返回列表
🧠 阿头学

Uber 软件工厂的 AI 成本工程与范式转移

Uber 通过构建全托管智能体集群与精细化上下文治理,成功将 AI 编码成本与使用规模解耦,证明企业级 AI 降本的核心在于架构重构而非单纯依赖模型降价。
打开原文 ↗

@udaykiran 2026-08-30 原文链接 ↗
阅读简报
双语对照
完整翻译
原文
讨论归档

核心观点

  • 全托管智能体取代交互式终端是规模化的唯一路径:将不可控的开发者个人会话迁移至集中调度的托管集群,使企业能够强制实施模型路由与执行标准,从而彻底切断成本随规模线性膨胀的必然性。
  • 上下文锚定与按需加载是消除 Token 浪费的工程基石:智能体 70% 以上的冗余消耗源于盲目搜索与全量 Schema 预加载,通过构建 AI 上下文图谱与 MCP 转 CLI 动态解析,可直接将无效交互成本削减 50% 至 90%。
  • 子智能体降级路由与帕累托模型选择构成核心降本杠杆:主模型仅负责任务拆解与质量评估,将边界清晰的子任务强制路由至低成本模型,能在不牺牲主链路质量的前提下实现单位成本断崖式下降。
  • 实时可见性比硬性预算更能驱动行为优化:通过状态行成本计数器与反模式诊断仪表盘,将 ROI 评估权下放给工程师,利用透明化反馈替代行政管控,能更有效地遏制隐性算力滥用。

跟我们的关联

  • 对 ATou 意味着:当前依赖人工交互的 AI 辅助模式存在严重的成本不可控风险,必须向标准化托管工作流转型;下一步应建立内部基准测试集,强制推行“主模型拆解+子智能体执行”的路由架构,并接入实时成本监控面板。
  • 对 Neta 意味着:单纯堆砌模型参数无法解决长尾场景的效率瓶颈,上下文治理才是产品护城河;下一步需重构工具调用层,采用按需加载与批处理脚本替代全量 MCP 预载,并建立反模式自动诊断机制以优化开发者体验。
  • 对 Uota 意味着:成本优化不能仅停留在财务压价层面,必须转化为可度量的工程指标;下一步需拆解 AI 支出公式,针对请求轮次与单次 Token 负载设定硬性优化阈值,并将优化结果直接挂钩团队技术债考核。

讨论引子

1. 全托管智能体集群在剥夺开发者灵活控制权的同时,是否会引发隐性技术债累积与创新意愿下降?企业应如何量化并补偿这种“黑盒化”带来的体验折损? 2. 当供应商调整缓存计费逻辑或上下文窗口策略时,高度耦合的精细化优化方案将瞬间失效,团队应如何构建不依赖特定厂商定价规则的底层成本防御架构? 3. 在缺乏 Uber 级别重资产基建的中小团队中,这套方法论的哪些杠杆具备直接复用价值,哪些属于脱离业务实际的过度设计?

如今,AI 工具已深度融入 Uber 软件开发的各个阶段。超过 70% 的拉取请求(Pull Requests)由本地或云端智能体(Agents)完成。工程师们在软件开发生命周期(SDLC)中构建了超过 3,600 项智能体技能(Agent Skills),每日智能体技能执行次数超过 3 万次。

在 AI Engineer 2026 大会上,我们分享了关于“软件工厂(Software Factory)”的愿景,以及我们在整个生命周期中构建的基础模块与托管智能体(Managed Agents)。随着这一愿景的推进,越来越多的会话不再由人类发起,而是由自动化的托管智能体负责处理代码审查、自动修复 CI 失败、通过视觉验证完成端到端(E2E)PR、分类处理待命警报、调试新出现的 Bug,并在人工审查/升级机制的辅助下处理各类代码维护任务。

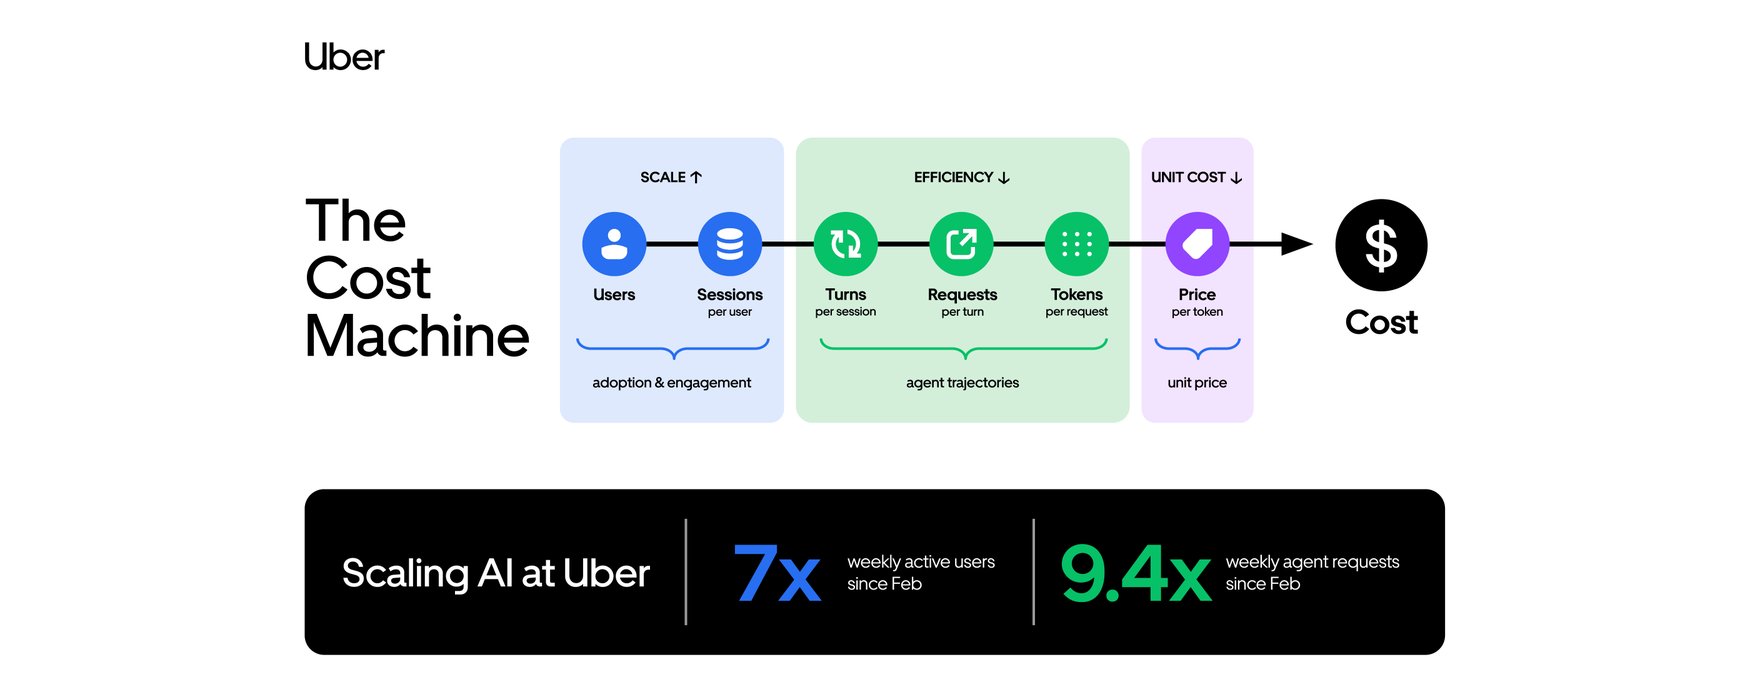
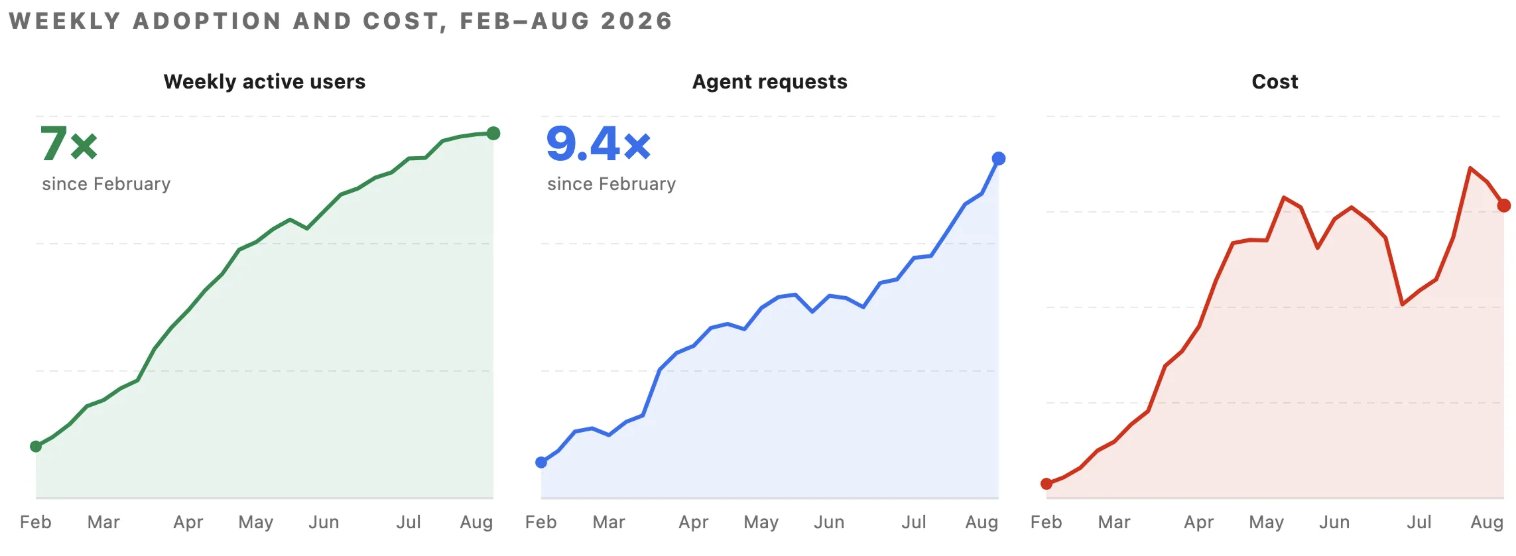
如图 1 所示,从 2026 年 2 月至 8 月,我们全体员工(工程师与非工程师)在所有智能体服务(Agentic Offerings)上的周活跃用户数增长了 7 倍,周智能体请求量增长了 9.4 倍。与此同时,得益于全面的优化措施,我们的 AI 总支出自 4 月以来已趋于相对稳定。 图 1:2026 年 2 月至 8 月中旬的周活跃用户、智能体请求量与成本数据(用户已跨工具去重)。

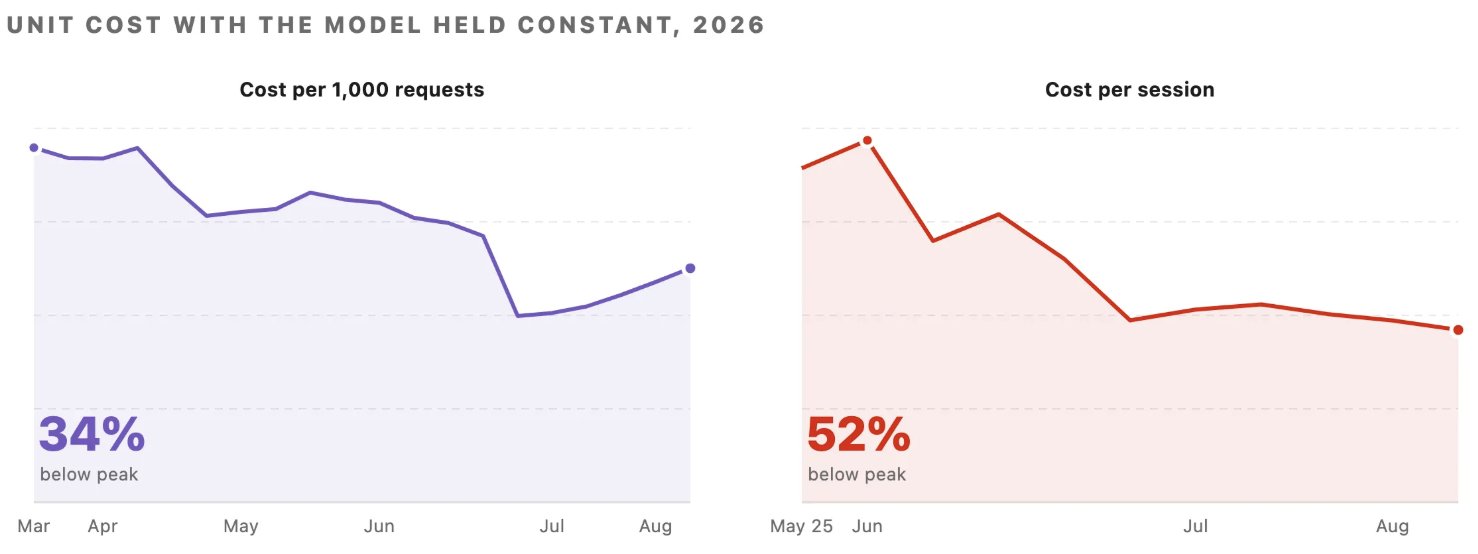
由于采用率、工作负载组合以及模型升级都在持续变化,要准确剥离我们自身的优化收益,就必须固定单一模型进行测试,因为每次升级或更换模型家族都会导致行为发生变化。我们在 2 月至 7 月期间采用了这一方法:每 1,000 次模型请求的成本较峰值下降了近 34%,单次会话成本较 6 月峰值下降了 52%。 图 2:固定模型情况下的成本优化效果。*单次会话成本数据自 5 月底开始统计。 本文将详细阐述我们对“软件工厂”的思考框架:智能体会话运行的四个层级、用于拆解支出的成本公式、各项指标的测量方法,以及我们如何在每个层级上对这些指标进行优化。

本文对比中的所有定价与供应商指标均基于公开信息,成本效率的提升主要源于在标准分级定价体系内更智能地路由我们内部的 Uber 工作负载。尽管我们测得的具体成本降幅具有环境独特性,且实际效果会因代码库规模、团队大小及智能体工作流的不同而有所差异,但“基于真实工作负载进行基准测试,并围绕准确率与成本进行优化”的方法论具有普适性。

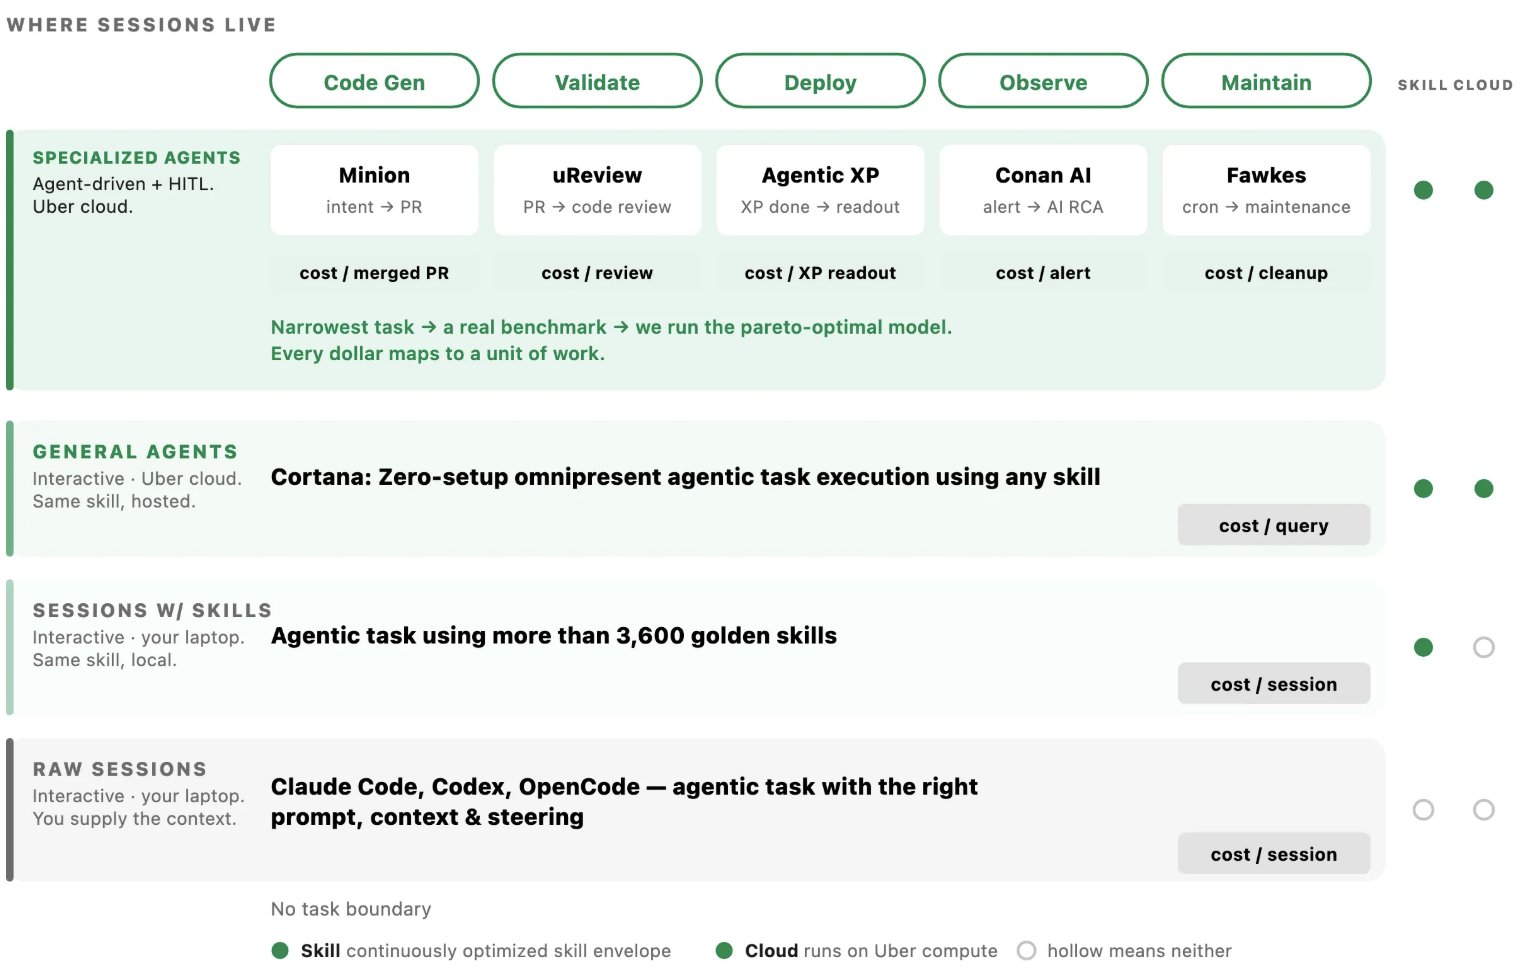
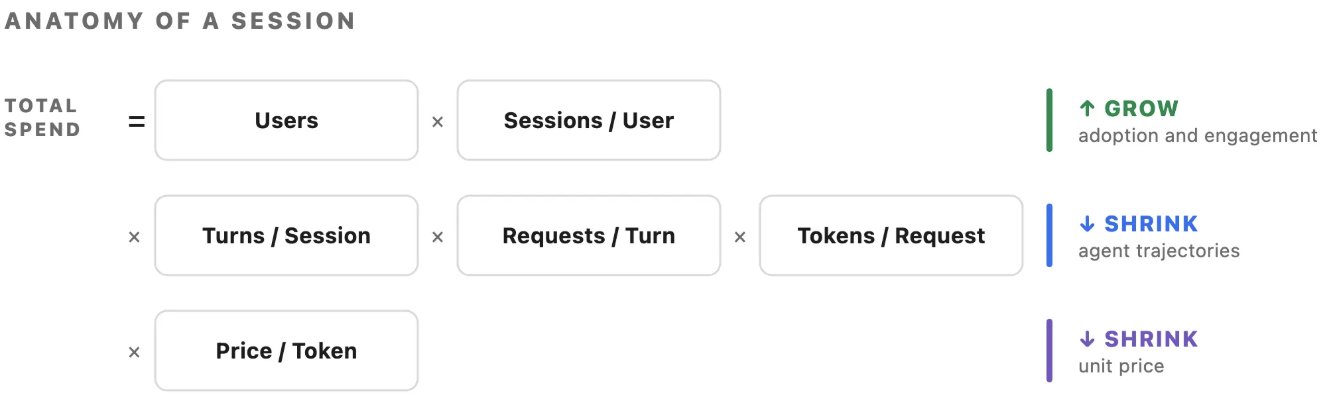
软件工厂及其成本公式 智能体使用的四个层级 我们将 AI 的使用划分为四个层级,从最专用到最通用。如图 3 所示,层级越高,我们在成本、质量和模型选择上的控制力就越强。 图 3:智能体会话运行的四个层级。 成本公式 在上述任意层级中,我们都可以将智能体会话的成本拆解为以下各项指标,并对其进行独立测量与优化。 图 4:总支出拆解为六个相乘的指标项。 前两项指标代表采用率与参与度,我们希望这些指标在整个用户群中持续增长,无论用户是交互式使用,还是由智能体代为处理任务。中间的三项指标则提供了优化空间:即智能体在工程师实际发起的请求之外,为自身运行所额外产生的工作。这也是我们投入精力最多的地方。其中包括帮助智能体更快规划、减少不必要的交互轮次或错误、优化输入 Token 等机制。

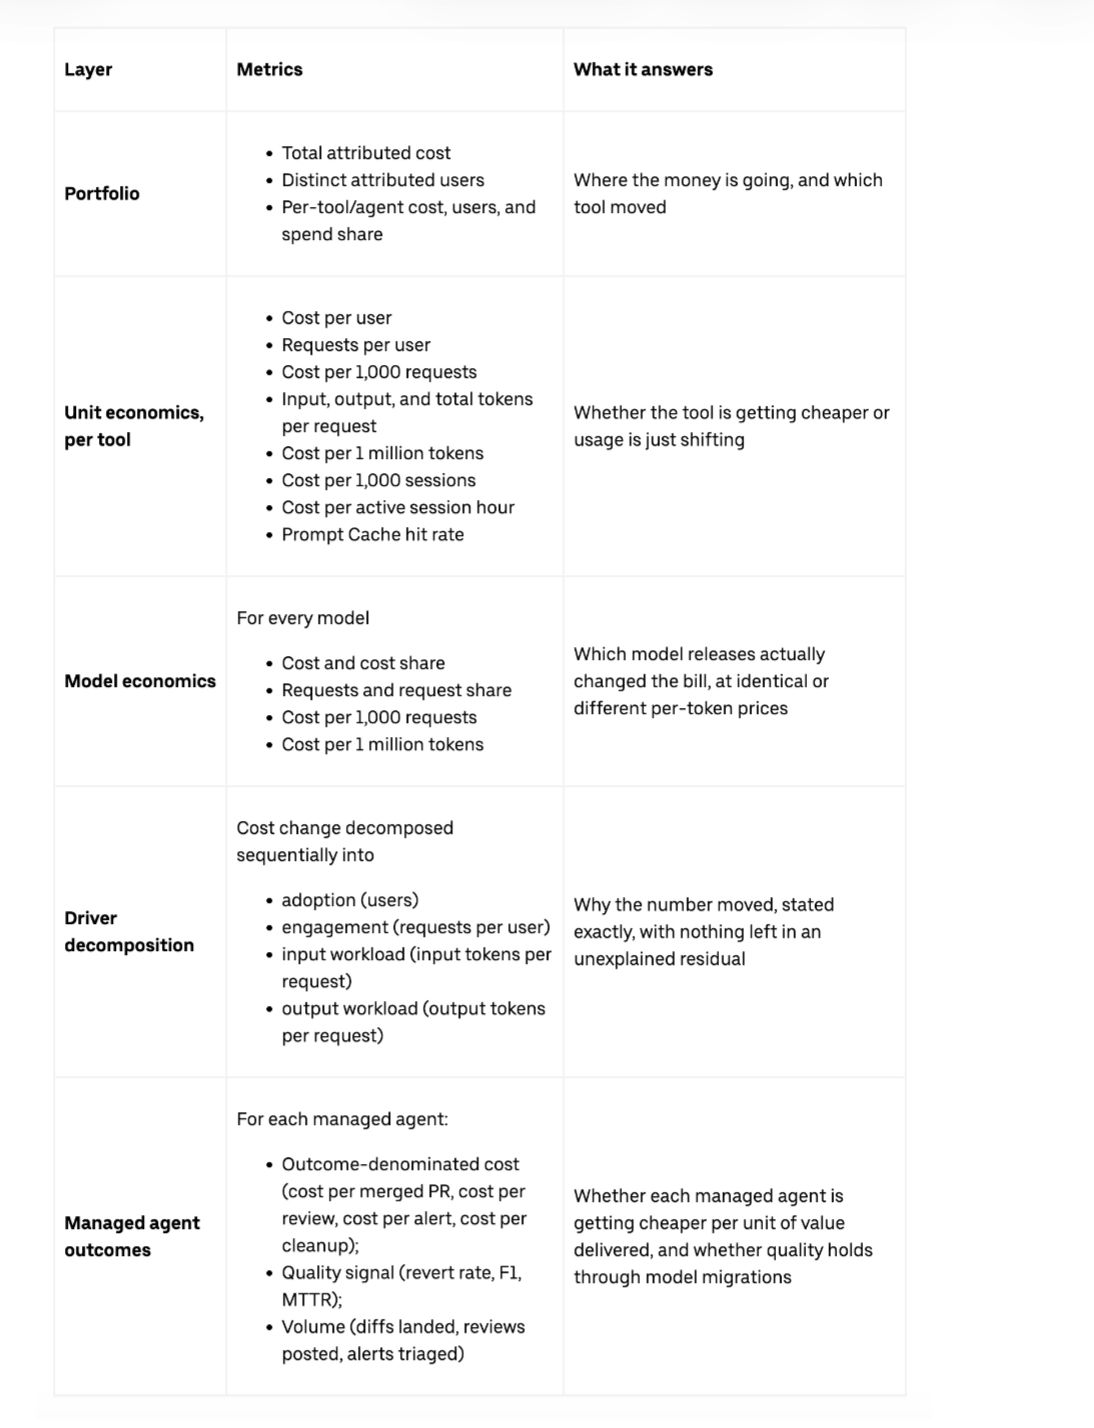
我们的测量方法 以下是我们每周和每月追踪的完整指标集,这些指标使我们能够进行短期与长期的预测及规划。

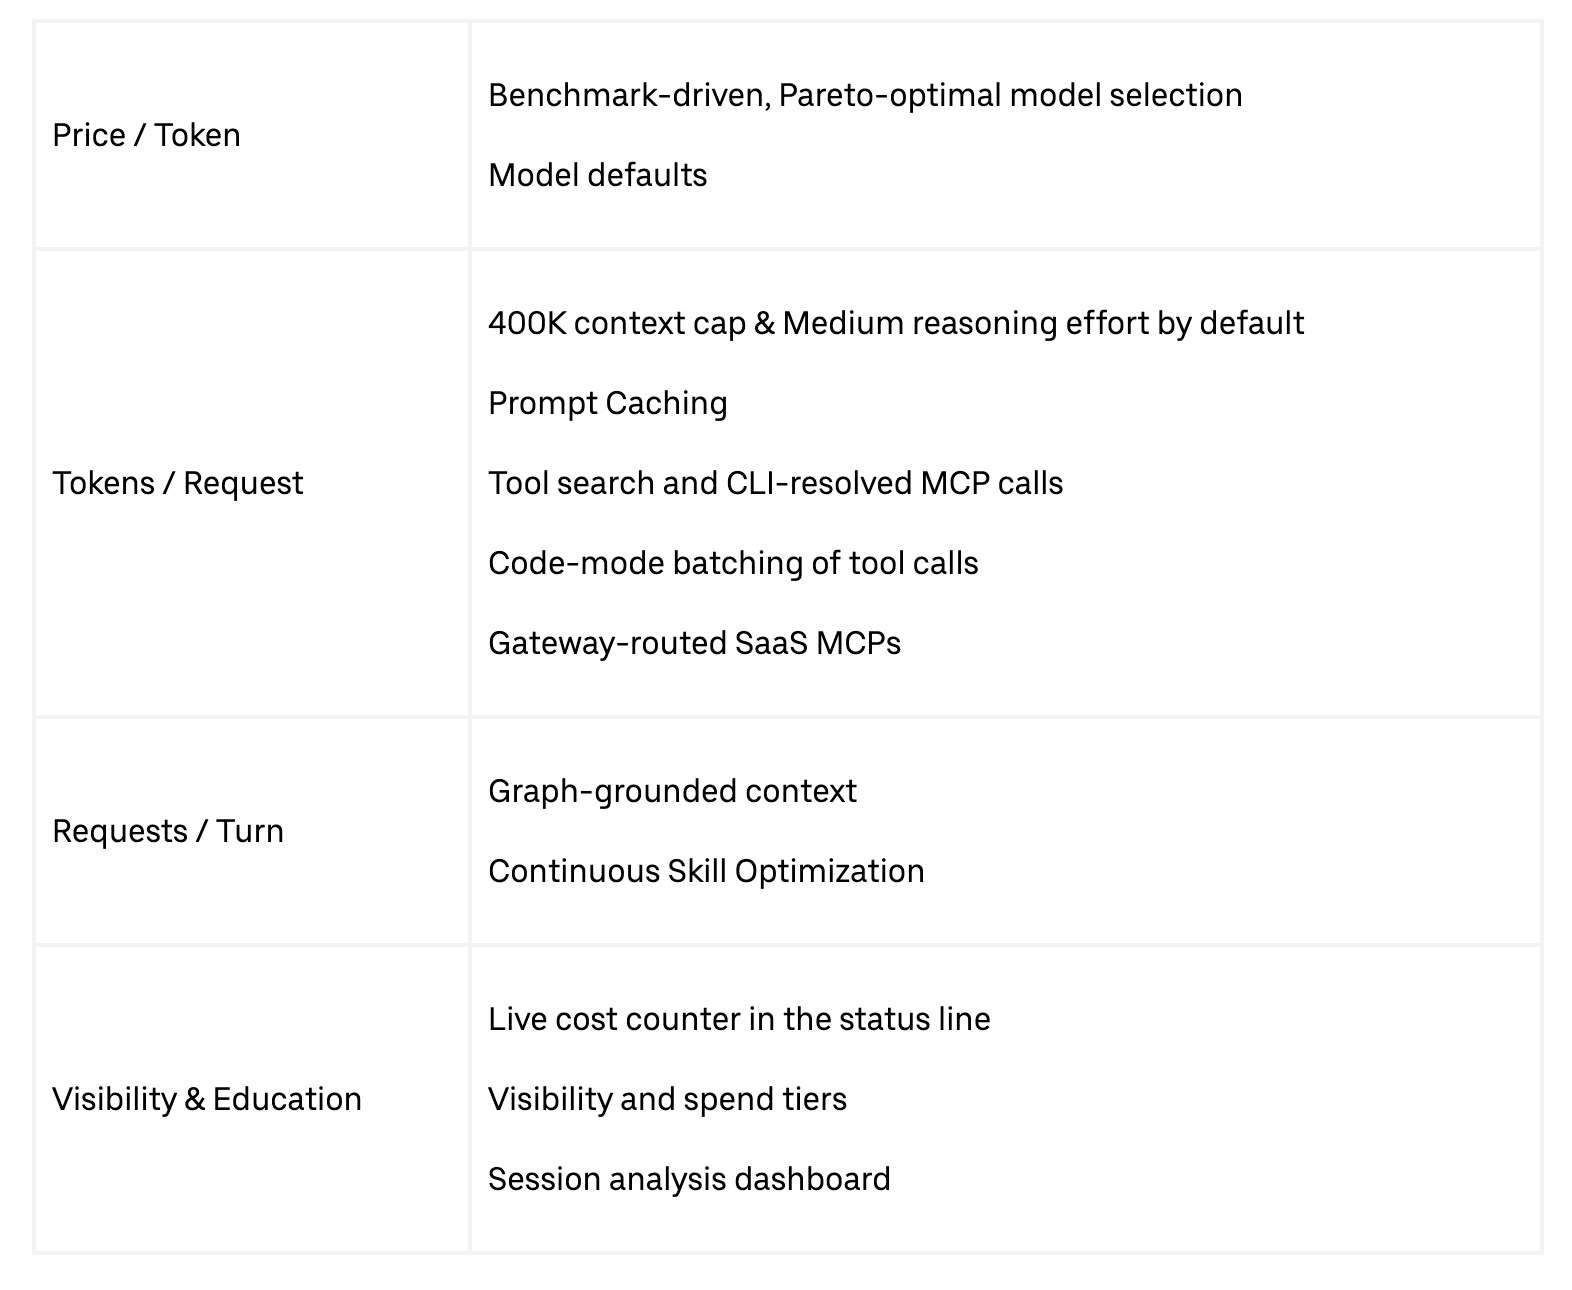
优化杠杆 在接下来的章节中,我们将详细说明用于优化成本公式各部分的关键杠杆。其中部分杠杆会影响成本公式中的一行或多行指标。

优化 价格 / Token Token 单价由供应商设定,而我们决定由哪个模型运行哪项工作负载。在所有托管智能体层级中,我们都会为特定工作负载选择帕累托最优(Pareto efficient)的模型。对我们而言,帕累托最优意味着在“单次完成任务成本”、“输出质量”和“模型可靠性”之间取得最佳平衡。

基于基准测试的模型选择 模型选择分为四个步骤,适用于我们运行的每一个托管智能体。 - 基于智能体的真实工作构建基准测试集。 - 在统一的执行框架(Harness)上运行智能体,该框架通过单一接口支持任意模型(无论是前沿闭源模型还是开源权重模型)。 - 持续迁移至帕累托最优的模型,并保持动态调整。最优前沿每几周就会发生变化。 - 展望未来,我们将持续利用托管智能体聚合的洞察来测试和部署多种模型路由策略,从而不断优化工作负载性能。

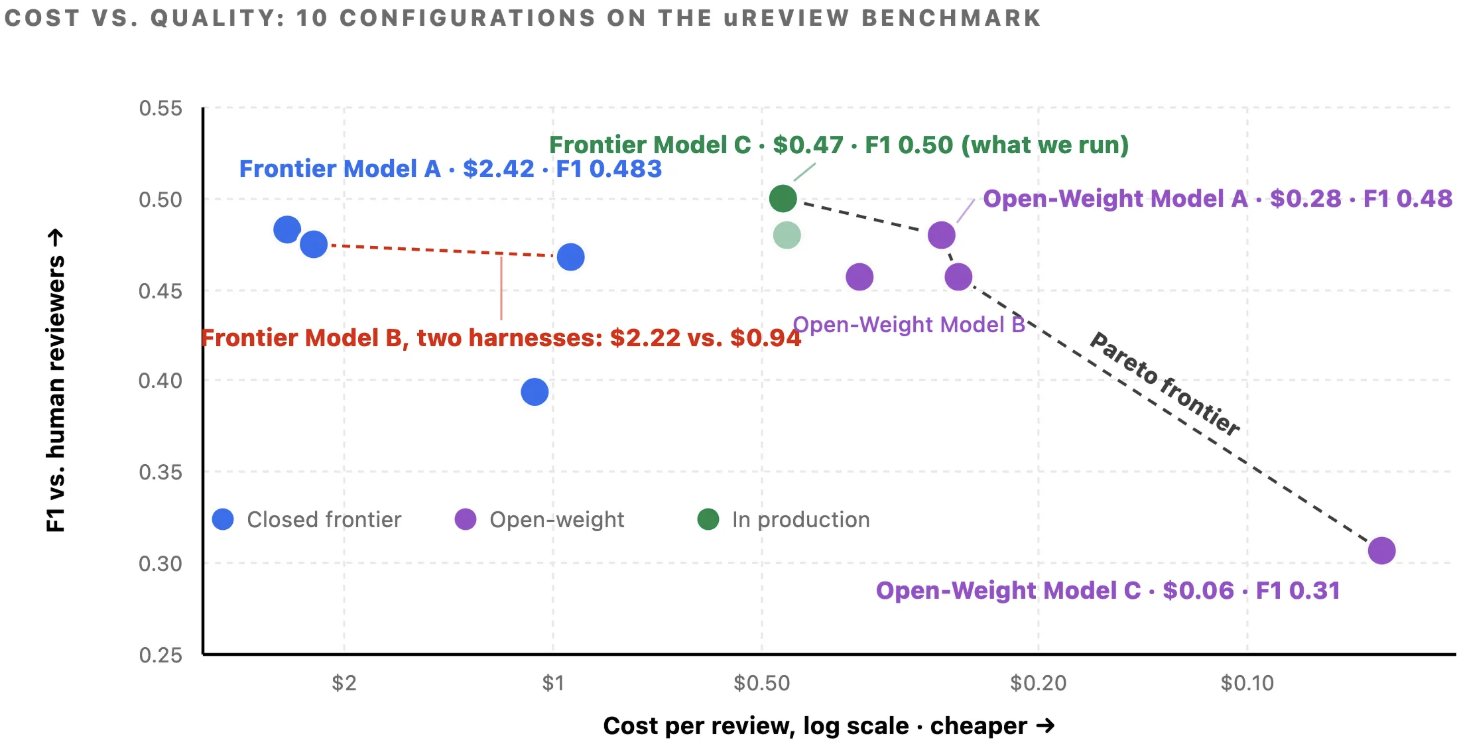
以 uReview 为例,该工具负责处理所有拉取请求的 AI 代码审查。我们基于包含已知 Bug 的真实 PR 构建了其基准测试集,并将其难度划分为简单、中等和困难。我们针对这些 Bug 计算精确率、召回率和 F1 分数,同时评估单次审查成本、延迟、超时和噪声。如图 5 所示,切换模型在提升 F1 分数的同时,大幅降低了单次 PR 成本。图中虚线代表帕累托前沿。位于该线左下方的所有配置,均被更便宜或更优的方案所超越。 图 5:我们为 uReview 测试的所有配置。 基于我们大型单体仓库(Monorepos)中的数千个真实 PR,我们内部还构建了一个 Uber SWE Benchmark,用于在不同任务类型上运行前沿模型与开源权重模型。该基准测试为我们在所有 SDLC 托管智能体中的模型选择提供决策依据。

默认模型选择 在交互式界面中,Token 单价保持固定;但我们可以策略性地管理 Token 在不同模型间的分配。两个默认设置主要控制这一分配:初始会话模型与子智能体(Subagent)模型。

事实证明,子智能体默认设置是最具影响力的优化杠杆,且其重要性仍在不断提升。随着最新模型能力支持更高效的多智能体编排,发起子智能体的会话比例稳步上升。由于子智能体通常执行定义明确、输入特定的任务,往往无需前沿级别的推理能力,因此我们默认将其分配给性能稍弱但更具成本效益的模型,同时保留手动覆盖的选项。主模型负责任务拆解与评估,而子智能体负责具体执行。

优化 Token / 请求 每次交互轮次都会重新发送完整的对话历史、项目上下文和工具结果。任何能减少单次请求负载的优化,都会在整个会话中产生累积效应。

默认配置 所有交互式执行框架均采用统一的封装层,用于安装管理、配置、身份验证和成本可视化。两项标准化默认配置直接降低了单次请求的 Token 消耗: - 自动压缩(Automatic compaction)在达到 40 万 Token 时触发,即使对于拥有 100 万上下文窗口的模型也是如此:该阈值在模型性能、缓存突发与重复输入 Token 成本之间取得了平衡。我们的测量数据显示,全集群单次请求的输入 Token 数量实现了显著下降。 - 推理强度(Reasoning effort)默认设置为“中等”:输出 Token(包括内部推理 Token)在主模型上的计费倍率高于输入 Token;此项策略调整直接降低了最高成本 Token 类别的支出。对于大量任务而言,“中等”推理强度在成本与质量之间取得了良好平衡。

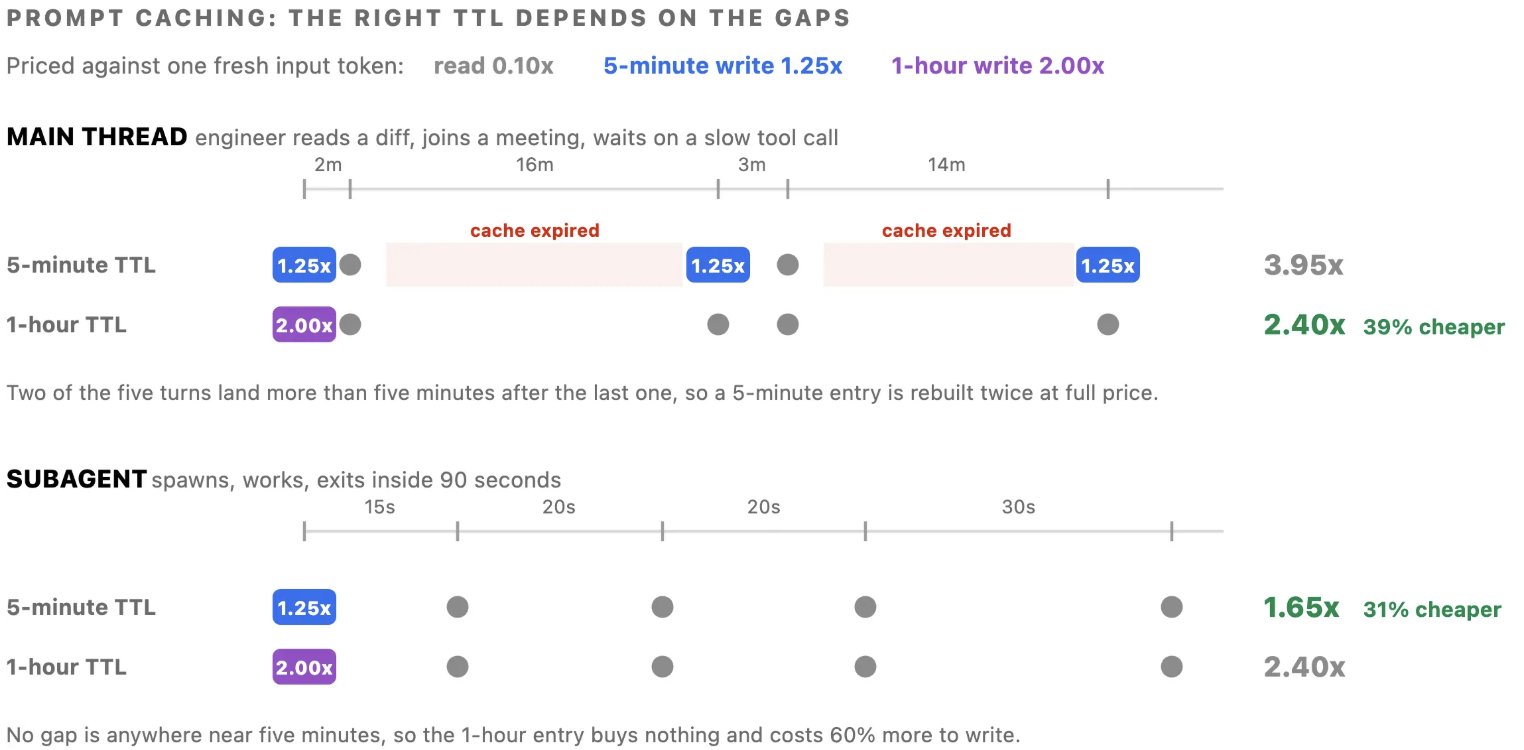
提示词缓存策略 我们的提示词缓存策略由供应商提示词缓存读写成本的经济性驱动。由于每次交互都会重新传输完整的对话历史,缓存前置上下文可避免重复支付全额费用,将后续读取成本降至标准输入 Token 费率的 0.1 倍。然而,写入溢价有所不同:5 分钟缓存条目成本为 1.25 倍,1 小时缓存条目成本为 2 倍。因此,选择最优的生存时间(TTL, Time-to-Live)取决于交互轮次之间的间隔时长。可用的 TTL 选项包括 Anthropic® 提供的 5 分钟和 1 小时,以及 OpenAI® 提供的 30 分钟。 图 6:两种 TTL 时长下 5 轮交互的对比。 由于工程师经常让交互式会话空闲超过 5 分钟,我们将默认的 5 分钟 TTL 切换为 1 小时窗口。此前,频繁的空闲间隔会导致前缀缓存失效,迫使系统以全价重建上下文,成本高昂。相比之下,子智能体仍保留 5 分钟的缓存 TTL,因为它们的执行范围仅限于单一、短生命周期的任务。

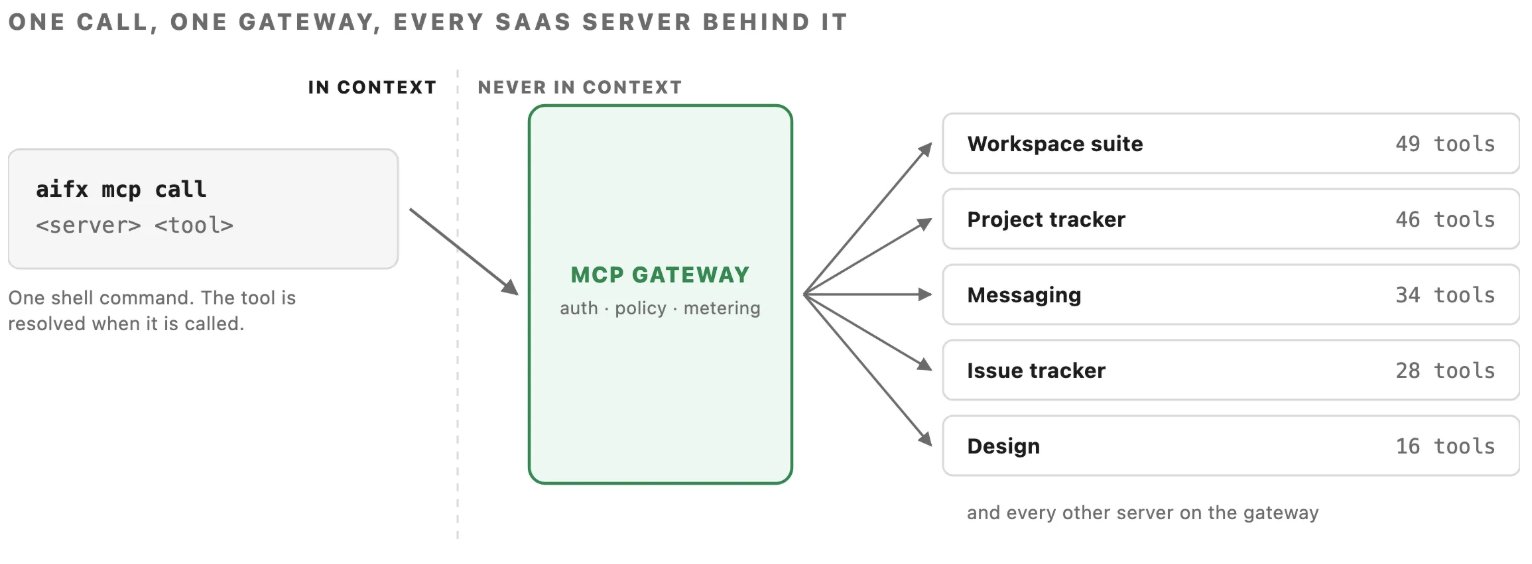
通过 Shell 执行 MCP 工具 在 Uber,所有 MCP(模型上下文协议,Model Context Protocol)交互均通过统一网关进行路由。这一单一入口涵盖了内部及第三方 SaaS 的 1,000 多个 MCP 服务器,实现了集中式身份验证与策略执行。

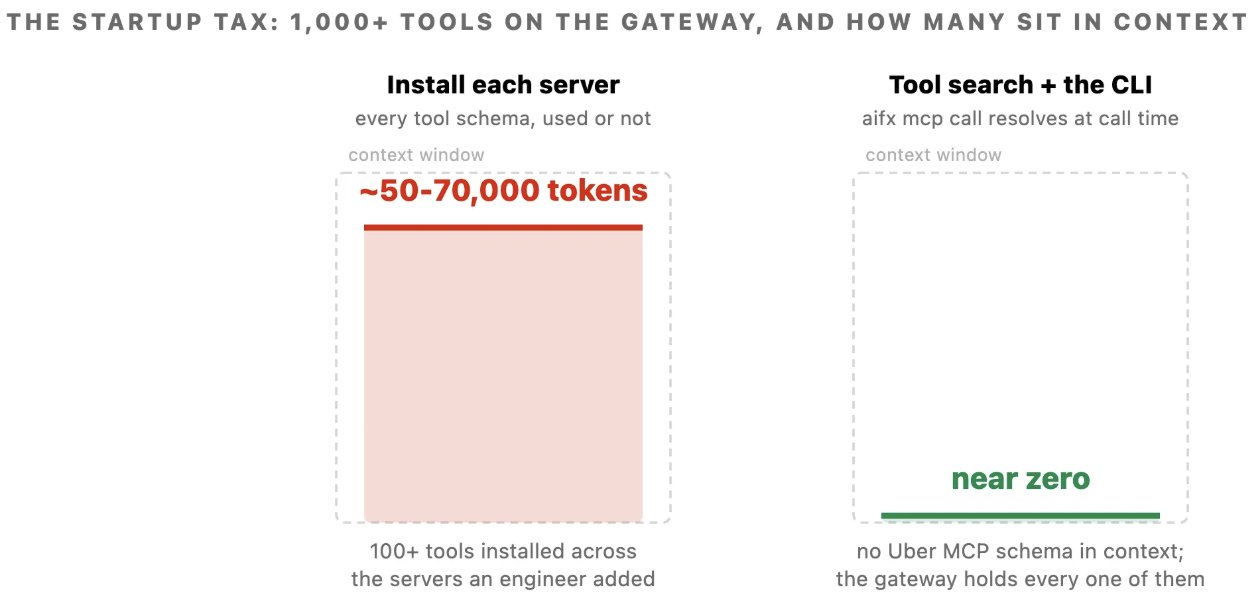
然而,标准 MCP 会将所有工具模式(Schemas)直接加载到每个会话中,无论工程师在该会话中是否会调用它们。例如,安装超过 100 个工具时,这种预加载会在初始提示词中增加约 5 万至 7 万 Token 的模式开销,并在每次上下文轮次中重新发送。 图 7:在三种访问相同工具的方式下,智能体在会话开始时已携带的负载。

为解决上下文膨胀问题,我们引入了两种互补的优化机制: - CLI 工具解析:通过允许模型执行 Shell 命令来替代直接的 MCP 集成。CLI 在调用时动态向网关解析并调用所需工具,从而从会话上下文中剔除 Uber MCP 模式。我们内部 MCP 网关的 1,000 多个 MCP 工具均被映射为 CLI 命令。 - 工具搜索:通过允许模型搜索工具目录并按需加载所需工具,可扩展至数千个工具。该方法有效缓解了上下文膨胀,通常能减少工具定义的 Token 使用量,并且在可用工具库不断扩大的情况下仍能保持高选择准确率,避免了大型工具集带来的性能衰减。

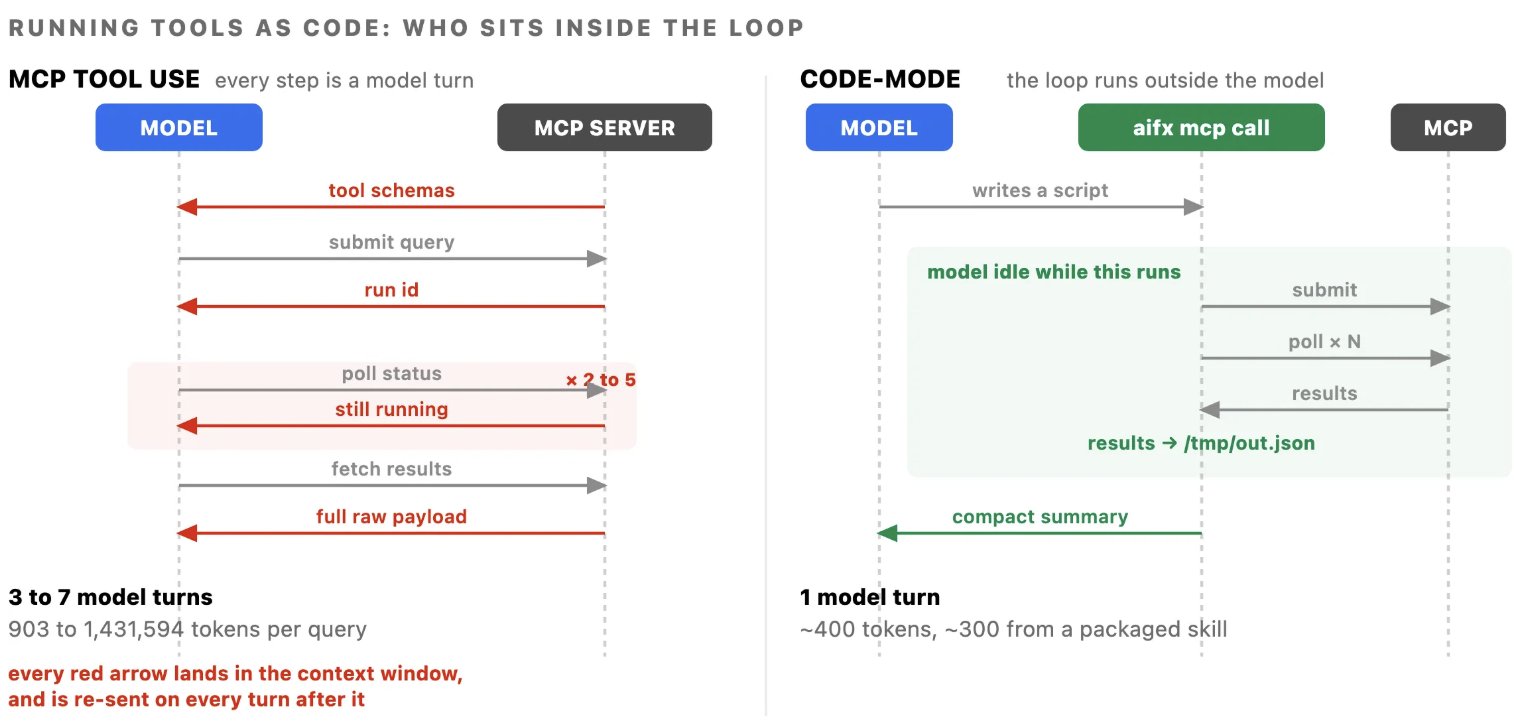
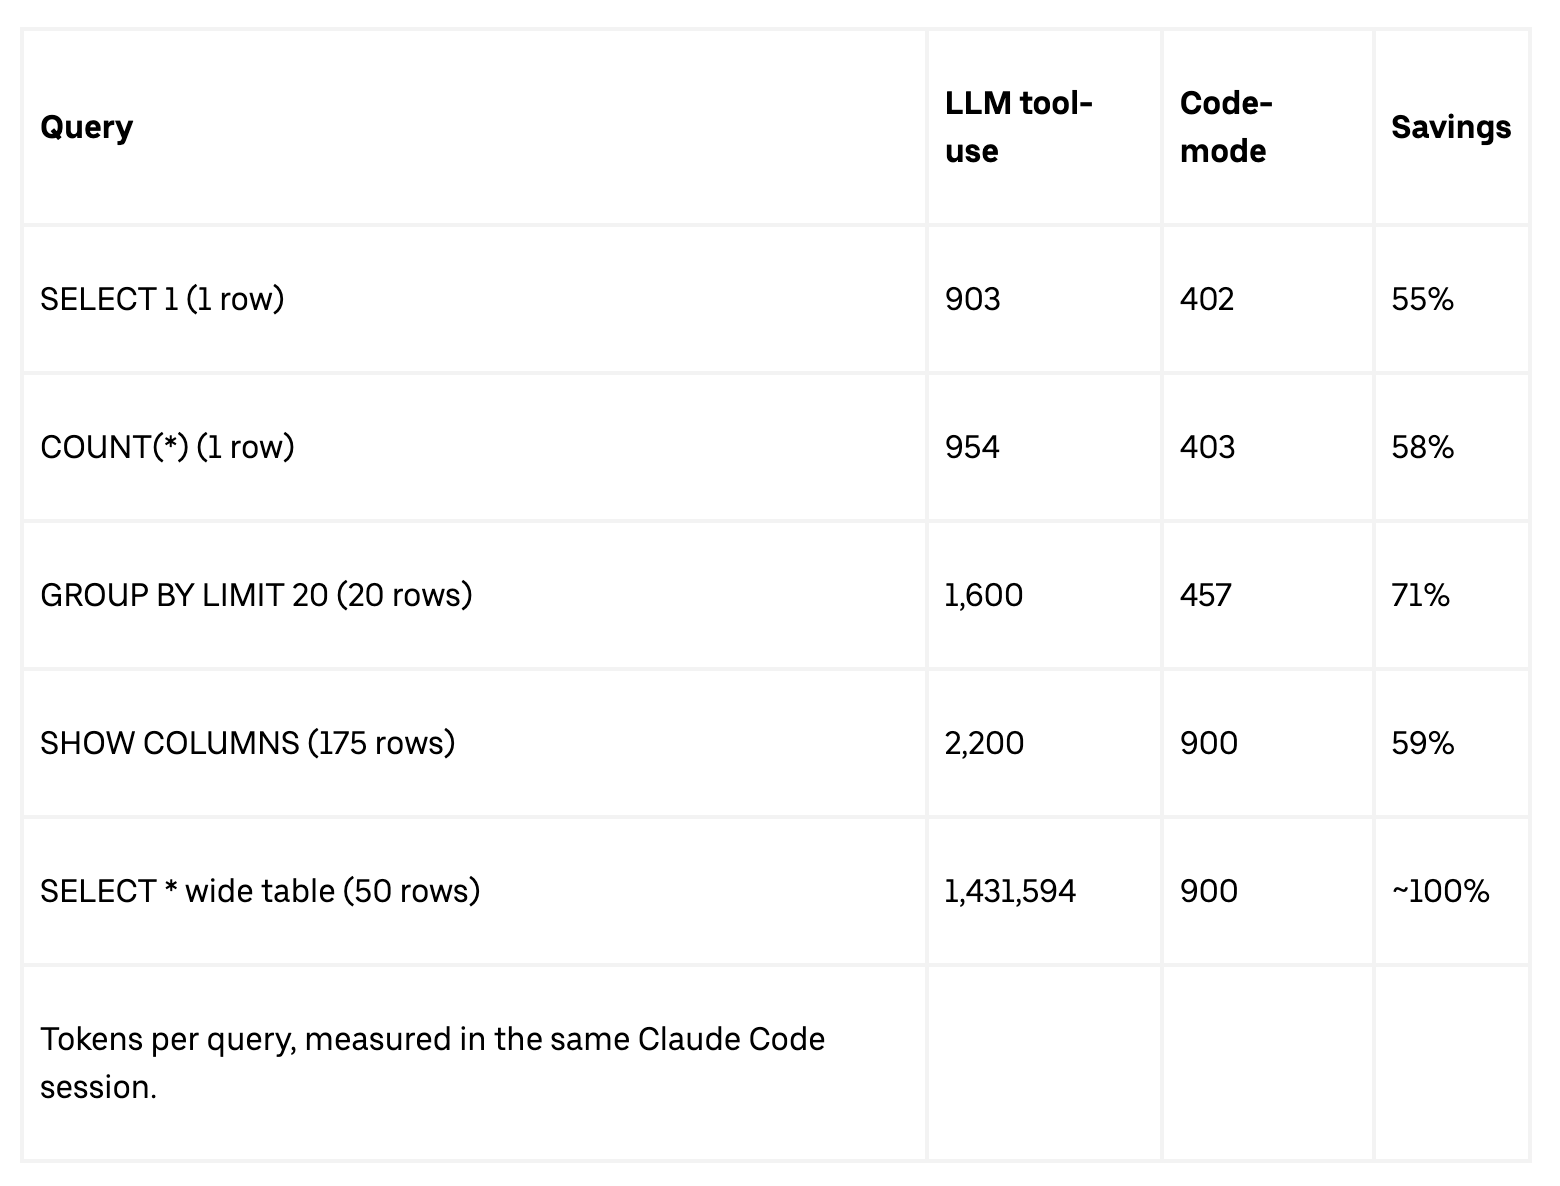
代码模式(Code-Mode) 当工具直接以 Shell 命令形式调用函数时,模型可以在单个脚本中批量执行多个操作。这种批处理对于交互频繁的工具协议尤为有利。在标准 MCP 工作流中,每个操作都需要模型单独发起一轮交互来发送请求、将原始响应加载到上下文窗口中,并顺序处理结果。例如,执行单个 SQL 查询需要提交请求、轮询状态 2 到 5 次,然后检索输出。代码模式将整个流程简化为自动化的 Python 循环,使中间轮询过程脱离模型的活跃上下文。如图 8 左侧所示,模型参与轮询循环,每次响应都会进入其上下文。而在右侧,循环在子进程中运行,仅返回最终摘要。 图 8:同一数据仓库查询的两种执行方式。 我们在同一会话中通过两种路径运行了 5 个相同的 SQL 查询,并进行了测量: 前三行数据突出了核心发现:即使对于远低于响应大小限制的最小结果集,代码模式也能将 Token 使用量减少 50% 以上。这些效率提升并非源于绕过大型数据负载,而是消除了不必要的开销,包括模式初始化、多轮轮询以及冗余的逐步推理。 批量工作流会进一步放大这一效果,因为原本需要 N 轮模型交互的循环被合并为一个脚本,节省比例累积超过 90%。通过为我们访问最频繁的 MCP 服务器部署 25 个以上的预构建代码模式技能,我们确保了标准工作流默认采用最具成本效益的路径。

SaaS MCP 服务 管理第三方软件被证明比管理我们的内部服务器更具挑战性。供应商设计 MCP 服务器时倾向于暴露完整的产品能力,因为他们无法预测客户的具体使用场景。例如,某办公套件将 49 个工具捆绑在单个服务器中,需要约 2.2 万 Token 的模式开销;而消息传递和项目跟踪供应商分别提供 34 个和 46 个工具。加载两三个供应商服务器,会导致智能体在用户输入提示词之前就携带了比正在编辑的文件还要大的模式开销。

为解决这一问题,我们采用与内部 MCP 相同的机制,将 SaaS MCP 服务器路由至我们的 MCP 网关。我们还将所有这些 MCP 暴露为 CLI,供任何智能体界面调用。此外,我们在代码模式插件中为每个服务器编写了专用技能,以封装常见工作流。此举为众多 SaaS 供应商解锁了高效的智能体工作流。 图 9:每个 SaaS MCP 服务器均通过我们的 MCP 网关暴露,以确保统一、高效的访问模式。

优化 请求 / 交互轮次 缺乏上下文锚定(Ungrounded)的智能体往往失败得缓慢而非廉价,它会反复发送不断膨胀的上下文窗口去尝试搜索下一个位置。在初始阶段提供更丰富的信息,依然是降低此类搜索开销最核心的优化杠杆。

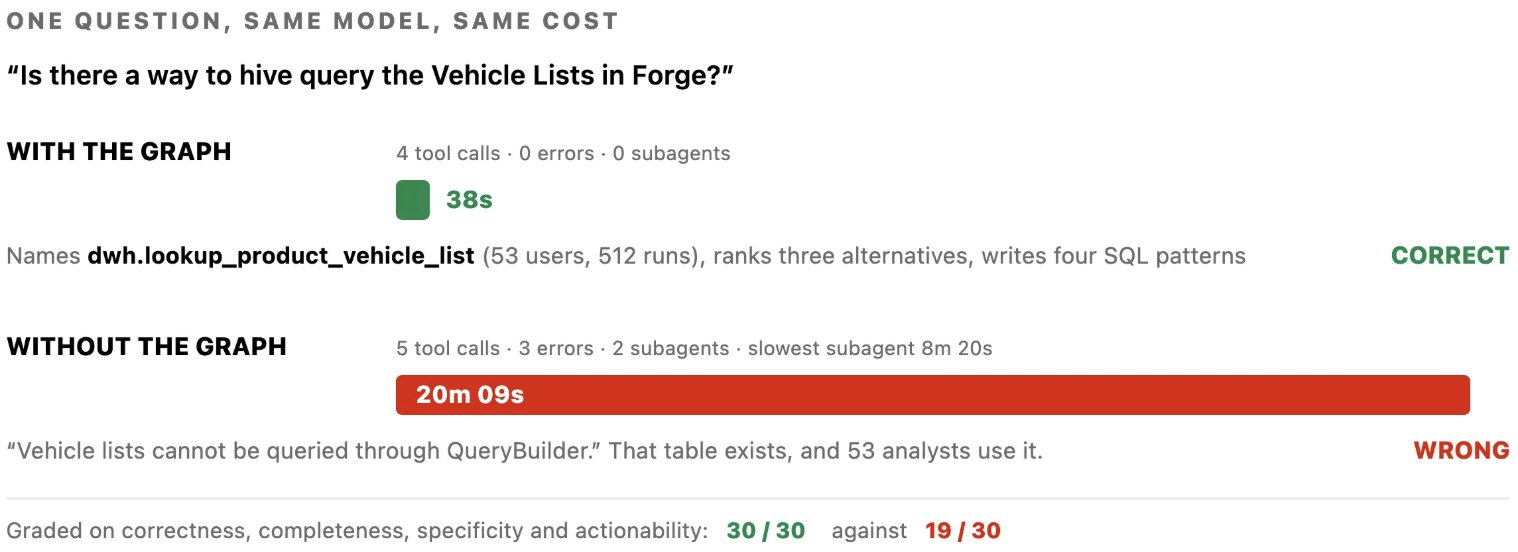
上下文工程(Context Engineering) 在 Uber 庞大的代码库与数据生态系统中(包含数亿行代码和数千张数据表),智能体将大部分交互轮次用于定位信息,而非生成代码。为此,我们构建了 AI 上下文图谱(AI Context Graph):一个包含 2,400 万个节点和 8,000 万条边的统一网络,涵盖 86 种节点类型和 117 种边类型。它整合了来自 30 多个内部系统的数据,包括服务、工程团队、事件日志、拉取请求、架构设计文档、部署记录、数据集以及历史表使用查询,并允许任何智能体通过自然语言对其进行查询。 图 10:向同一模型提交相同提示词时,有图谱锚定与无图谱锚定的执行路径对比。

经过图谱锚定的智能体查询了历史使用情况,识别出被 50 多位分析师使用的特定数据表,并在 38 秒内给出了答案。相反,未经锚定的智能体对该表缺乏可见性;它花费了 20 分钟检查服务代码、派生了 2 个子智能体、触发了 3 次错误,最终错误地得出该数据集无法查询的结论。

可见性与教育 此处的优化杠杆在于可见性与反馈循环,它们能帮助工程师和智能体更快地达成一致。

状态行(Status Line) 我们在执行框架的状态行中加入了实时成本计数器,用于追踪每个框架及每位用户所有框架的实时支出。 图 11:状态行,以及随附的会话分析器与效率指南。

可见性与支出分级 为避免实施严格的硬性上限,我们实现了实时支出追踪与自动提醒机制: - 状态行实时计数器。运行中会话的成本始终在终端中可见。 - 框架池(Harness Pool)。所有交互式框架共享一个支出分级额度,而非按工具单独设置预算。托管智能体则设有独立的分级额度。 - Slack 提醒。在达到预期支出的 50%、80% 和 100% 时发送警报,以便工程师有时间进行规划。 - 简易审批流程。分级额度升级只需经理审批,并快速生效。 - 成本检查技能与提示。提供按需成本拆解的仪表盘技能,以及实时状态行指导。 这些机制使工程师能够独立评估任务的投资回报率(ROI),同时有效遏制成本失控。

会话分析仪表盘 尽管状态行突出了会话的总支出,但它无法揭示成本驱动因素或提供可执行的效率改进步骤。通用指南仅提供高层级原则,无法评估单个开发者的工作流。会话分析仪表盘通过直接检查会话产物来弥补这一差距。

该功能直接内置于运行时中,无需任何设置或主动启用。执行成本仪表盘技能即可分析用户在其使用的所有框架中,本地与远程云沙盒的所有会话追踪记录。它不生成聚合指标,而是标记出会话中 16 种不同的反模式(Anti-patterns),并为每种模式附上财务影响与针对性的修复建议。部分类别包括: - 模型路由次优:在 Opus 模型上执行简单的多轮会话,而此类任务本可由 Sonnet 轻松完成。 - 上下文窗口膨胀:大型 MCP 负载(例如 40KB 的响应)持续保留在上下文中,导致后续轮次重复计费。 - 缓存过期低效:长时间中断后恢复会话,过期的提示词缓存迫使系统以全价重建前缀。 - 提示词初始化开销:在提供任何用户输入之前,预加载 10 万 Token 的系统指令与工具定义。 图 12:会话级成本仪表盘识别浪费模式与潜在节省空间。

下一步计划? 当前正在推进的举措包括: - 扩大托管智能体集群:对于每个新智能体,我们遵循一致的路线图:确立目标结果指标、构建评估基准测试集,并识别帕累托最优模型。这一系统化方法旨在将 SDLC 的每个阶段提升至软件工厂成熟度模型的更高层级。 - 动态模型路由:我们正在扩大基准测试的覆盖范围,涵盖多种编程语言、代码仓库和智能体模态。鉴于模型能力差异巨大,有效的模型路由高度依赖于全面的评估。 - 深化上下文图谱集成:我们正在为更广泛的自主智能体解锁图谱查询能力。 - 将会话分析演进为实时开发者指导:通过从定期批量检测反模式转向持续追踪监控,我们旨在直接向工程师提供个性化、实时的效率建议。 - 持续技能改进:我们正在开发一种自动化方法,用于记录智能体技能执行中的细微痛点(Papercuts),并根据收集的追踪记录自动生成技能更新。

结论 管理与遏制不断攀升的 AI 编码成本,同样是一个可解的工程挑战。通过消除浪费的、零价值的 Token 消耗,而非单纯依赖降低单价或降级工具,我们在将使用规模扩大 7 倍的同时,全面降低了各项指标的单位成本,并提升或保持了输出质量。

核心战略转变在于从交互式开发者工作流转向全托管智能体。将 SDLC 工作负载迁移至托管环境,使我们能够完全掌控模型路由、执行框架与运营支出。优化一个由专用托管智能体组成的集群(每个智能体均配备专属评估基准与帕累托最优模型),其成本效益与可扩展性天然优于优化数千名工程师各自的终端会话。

致谢 这是众多工程师共同努力的成果,他们正在构建最高效的基础模块,以在 Uber 规模上落地软件工厂,同时确保我们花费的每一个 Token 都能获得投资回报。我们要感谢参与软件工厂各项工作的核心团队成员:Abhishek Bhatia, Adam Huda, Aditya Patel, Alok Srivastava, Ameya Ketkar, Anil Purohit, Atakan Kandemir, Ben Chou, Brandon Barker, Danielle Yim, Deepanshu Mehndiratta, Gaurav Gill, Israel Marban, Jason Varbedian, Karen Xu, Lei Shi, Mager Mager, Meghana Somasundara, Peng Liu, Preet Inder, Qiushen Wang, Rush Tehrani, Shesh Patel, Shiven Tripathi, Shubham Gupta, Stas Khalup, Ting Chen, Tse-Shi Wang, Ty Smith, Vikram Hullukunte, Weiqiang Wang, Will Bond。 同时感谢 Johannes Gehrke, Mattie Toia, Sumanth Sukumar 和 Praveen Neppalli Naga 提供的领导与支持。

Anthropic® 是 Anthropic PBC 的注册商标。 Claude Code™ 和 Claude® 是 Anthropic, PBC 的商标。 OpenAI® 及其徽标是 OpenAI® 的注册商标。

Post author: @udaykiran AI tools are now embedded in every phase of software development at Uber. More than 70% of pull requests are attributed to local or cloud agents. Engineers have built over 3,600 agent skills across the software development life cycle, and executed more than 30K agent skill executions per day. At the AI Engineer 2026 conference, we shared our vision for the Software Factory and the building blocks and managed agents we are building across the lifecycle. As we progress on that vision, a growing share of sessions aren’t initiated by humans, but by automated managed agents handling code review, self-healing CI failures, completing E2E PRs with visual validation, triaging on-call alerts, debugging incoming bugs, and handling a variety of code maintenance tasks with human reviews/escalations. As shown in Figure 1, from February to Aug 2026, weekly active users across all agentic offerings across all our employees (engineers & non-engineers) grew 7x, and weekly agentic requests grew 9.4x. Meanwhile, our total AI spend has relatively stabilized since April due to optimizations across the board. Figure 1: Weekly active users, agent requests, and cost from Feb–Mid Aug 2026, with users deduplicated across tools.

Since adoption, workload mix, and model upgrades are all continuously changing, isolating our own optimization gains means holding one model fixed, since behavior shifts with every upgrade and model family. We did that from February to July: cost per 1,000 model requests is down almost 34% from its peak, and cost per session is down 52% from its June peak. Figure 2: Cost optimization impact with model held constant. *Cost/session data starts from end of May. This blog walks through how we think about our software factory: the four layers agent sessions run in, the cost equation we use to decompose spend, how we measure each term, and how we optimize those terms across every layer. All pricing and vendor metrics in this comparison are based on publicly available information, with cost efficiency gains driven by routing our internal Uber workloads more intelligently within standard tier-pricing. While specific cost reductions we measure are unique to our environment and your mileage may vary depending on your codebase, team size, and agent workflows, the methodology of benchmarking real work and optimizing for accuracy and cost is universally applicable. The Software Factory and Its Cost Equation Four Layers of Agent Usage We organize AI usage into four layers, from the most specialized to the most general. As shown in Figure 3, the higher the layer, the more control we have over cost, quality, and model selection. Figure 3: The four layers where agent sessions run. The Cost Equation Across any of the layers above, we can decompose the cost of an agentic session into the following terms, which we could measure and optimize independently. Figure 4: Total spend, decomposed into six terms that multiply. The first two terms represent adoption & engagement, which we want to keep growing across our overall user base, whether users use it interactively or agents handle tasks on their behalf. The three middle terms provide opportunities for optimization: the work the agent does on its own behalf, on top of the request an engineer actually made. That is where most of our effort goes. This includes mechanisms that help agents plan faster, reduce unwanted turns or errors, optimize input tokens, and more. How We Measure Below is the full set of metrics we track weekly and monthly that enable us to forecast & plan our efforts short-term and long-term. Optimization Levers In the following sections, we detail the key levers we used to optimize each part of the cost equation. Some of these levers affect one or more rows in the cost equation. Optimizing Price / Token The vendor sets the token price. We pick which model runs which workload. Across all our managed agents’ layers, we pick the model that’s most Pareto efficient for that workload. For us, Pareto efficient means cost/completed task, output quality, and model reliability. Benchmark-Driven Model Selection Model selection happens in four steps, the same for every managed agent we run. Build a benchmark out of the agent’s real work. Run the agent on a harness that serves any model, frontier or open-weight, behind one interface. Move to whatever is Pareto optimal, and keep moving. The frontier shifts every few weeks. Looking ahead, we continually refine our workload performance by leveraging aggregated insights from our managed agents to test and deploy various model routing strategies. For example, we use uReview, which handles AI code review for all pull requests. We built its benchmark from real pull requests with known bugs and graded them easy, medium, and hard. We score precision, recall, and F1 against those bugs, plus cost per review, latency, timeouts, and noise. As shown in Figure 5, switching models improved our F1 while dramatically reducing cost/PR. In the figure, the dashed line is the Pareto frontier. Everything below and left of it is beaten by something cheaper or better. Figure 5: Every configuration we tested for uReview. Using thousands of real-world PRs across our large monorepos, we internally also have an Uber SWE Benchmark that runs frontier and open-weight models across different task types. We use it to inform model selection across all our SDLC-managed agents. Default Model Selection In the interactive interface, token unit costs remain fixed; however, you can strategically manage token distribution across models. Two default settings primarily govern this distribution: the initial session model and the subagent model. The subagent default setting has proven to be the most impactful lever, and its significance continues to grow. The proportion of sessions initiating subagents has steadily increased as the latest model capabilities enable more effective multi-agent orchestration. Because subagents perform well-defined tasks with specified inputs that often do not require frontier-level reasoning, we default them to a weaker, more cost-effective model while still allowing manual overrides. The primary model handles task decomposition and evaluation while subagents execute the work. Optimizing Tokens / Request Every turn re-sends the full conversation history, project context, and tool results. Anything that reduces the per-request payload compounds across the session. Defaults All interactive harnesses use a unified wrapper for installation management, configuration, authentication, and cost visibility. Two standardized default configurations directly reduce token consumption per request: Automatic compaction is triggered at 400k tokens even for 1M context window models: This threshold balances model performance against cache bursts and repeated input token costs. Our measurements show a meaningful reduction in fleet-wide input tokens per request. Reasoning effort defaulted to Medium: Output tokens, including internal reasoning tokens, are billed at multiples of the rate of input tokens on primary models; this policy adjustment directly reduces spend in the highest-cost token category. For a large category of tasks, Medium reasoning hits a good balance between cost vs quality. Prompt Caching Strategy Our prompt caching strategy is driven by the economics of provider prompt cache reads and writes. Since each turn re-transmits the full conversation history, caching the preceding context avoids paying the full cost repeatedly, reducing subsequent reads to just 0.1x the standard input token rate. However, write premiums vary: 5-minute cache entries cost 1.25x, while 1-hour entries cost 2x. Choosing an optimal TTL (Time-to-Live) therefore depends on the duration of gaps between turns. Available TTL options include 5 minutes and 1 hour from Anthropic®, alongside 30 minutes from OpenAI®. Figure 6: A comparison of 5 turns under both TTL durations. Because engineers often leave interactive sessions idle for more than 5 minutes, we transitioned from the default 5-minute TTL to a 1-hour window. These frequent idle gaps previously invalidated the prefix cache, forcing costly full-price context rebuilds. Sub-agents, by contrast, retain a 5-minute cache TTL because their execution focus is limited to single, short-lived tasks. Executing MCP Tools via the Shell At Uber, all MCP (Model Context Protocol) interactions are routed through a unified gateway. This single entry point encompasses more than 1,000 MCP servers across internal and third-party SaaS MCP, enabling centralized authentication and policy enforcement. However, standard MCP loads all tool schemas directly into every session, regardless of whether an engineer will ever invoke them in that session or not. For example, with over 100 tools installed, this pre-loading added approximately 50K-70K tokens of schema overhead to the initial prompt, which was subsequently re-sent on every context turn. Figure 7: What an agent is already carrying at the start of a session, under 3 ways of reaching the same tools.

To address this context bloat, we introduced two complementary optimization mechanisms: CLI tool resolution: Replaces direct MCP integration by allowing the model to execute a shell command. The CLI resolves and invokes the required tool against the gateway dynamically at call time, eliminating Uber MCP schemas from the session context. All 1K+ MCP tools from our internal MCP gateway are projected as CLI commands. Tool search: Scales to thousands of tools by allowing the model to search the tool catalog and load only required tools on demand. This approach mitigates context bloat, typically reducing token usage for tool definitions, and maintains high selection accuracy even as the available tool library expands, preventing degradation associated with large tool sets. Code-Mode When tools call functions directly as shell commands, models can batch multiple actions within a single script. This batching is particularly advantageous for chatty tool protocols. Under standard MCP workflows, each action requires a separate model turn to emit a request, load the raw response into the context window, and process the results sequentially. For instance, executing a single SQL query requires submitting the request, polling status 2 to 5 times, and retrieving the output. Code-mode streamlines this entire flow into an automated Python loop, keeping intermediate polling out of the model’s active context. As shown in Figure 8 on the left, the model participates in the polling loop, and every response lands in its context. On the right, the loop runs in a subprocess, and only the summary comes back. Figure 8: The same warehouse query, both ways. We measured this by running 5 identical SQL queries through both paths in the same session: The initial three rows highlight the main finding: even for minimal result sets far below response-size limits, code-mode reduces token usage by more than 50%. Rather than bypassing large data payloads, these efficiencies stem from eliminating unnecessary overhead, including schema initialization, multi-turn polling, and redundant step-by-step reasoning. Bulk workflows compound the effect, because the loop that would have been N model turns becomes one script and the savings compound to more than 90%. By deploying more than 25 pre-built code-mode skills for our most-accessed MCP servers, we ensure standard workflows default to the most cost-effective path. SaaS MCPs Managing third-party software proved significantly more challenging than our internal servers. Vendors design MCP servers to expose full product capabilities because they can't anticipate specific customer usage. For instance, a workspace suite bundles 49 tools into a single server, requiring ~22K tokens of schema, while messaging and project tracking vendors ship 34 and 46 tools, respectively. Loading two or three vendor servers makes the agent carry more schema overhead than the file being edited before a user even enters a prompt. To address this, we route SaaS MCP servers through our MCP gateway using the same mechanism we do for our internal MCPs. We also expose all these MCPs as CLIs that any agentic surface can invoke. Additionally, we author dedicated skills within our code-mode plugin for each server to encapsulate common workflows. This unlocked efficient agentic workflows across many SaaS vendors. Figure 9: Every SaaS MCP server is exposed behind our MCP gateway to ensure a unified, efficient access pattern.

Optimizing Requests / Turn An ungrounded agent fails slowly rather than cheaply, repeatedly sending an expanding context window to search one more location. Providing richer information upfront remains the single most powerful lever to reduce this search overhead. Context Engineering Across Uber’s vast codebase and data ecosystem, comprising hundreds of millions of code lines and thousands of tables, agents spend most of their turns locating information rather than generating code. To address this, we engineered the AI Context Graph: a unified network containing 24 million nodes and 80 million edges across 86 nodes and 117 edge types. It integrates data from over 30 internal systems, including services, engineering teams, incident logs, pull requests, architectural design docs, deployments, datasets, and historical table usage queries, and lets any agent query it in natural language. Figure 10: Comparing execution paths for the identical prompt submitted to the same model, with and without graph grounding.

The grounded agent queried historical usage, identified the specific table used by over 50 analysts, and delivered the answer in 38 seconds. Conversely, the ungrounded agent lacked visibility into that table; it spent 20 minutes inspecting service code, spawning 2 subagents, and hitting 3 errors before incorrectly concluding the dataset was unqueryable. Visibility & Education The levers here are visibility and feedback loops that help engineers and agents converge faster. The Status Line We put a live cost counter in the harness status line that tracks live spend per harness and across all harnesses for each user. Figure 11: The status line, with the session analyzer and efficiency guide that ship alongside it.

Visibility and Spend Tiers To avoid imposing strict caps, we implemented real-time spend tracking and automated nudges: Statusline live counter. Running session cost is always visible in the terminal. Harness pool. One shared tier across all interactive harnesses, not per-tool budgets. And separate tiers for managed agents. Slack nudges. Alerts at 50/80/100% of expected spend so engineers have time to plan. Easy approval flows. Manager sign-off for tier upgrades with quick propagation. Cost check skill and tips. A dashboard skill for on-demand cost breakdown and live status line coaching. These enable engineers to evaluate task ROI independently while mitigating runaway expenses. Session Analysis Dashboard While the status line highlights a session's total expenditure, it lacks visibility into cost drivers or actionable efficiency steps. General guidance provides high-level principles, but can’t evaluate individual developer workflows. The session analysis dashboard bridges this gap by inspecting session artifacts directly. Built directly into the runtime, it requires zero setup or opt-in. Executing the cost dashboard skill analyzes all session traces for the user across local and remote cloud sandboxes across all harnesses they use. Rather than producing an aggregate metric, it flags 16 distinct anti-patterns across sessions, pairing each with its financial impact and a targeted remediation. Some of the categories include: Suboptimal model routing: Executing simple multi-turn sessions on Opus that Sonnet could easily fulfill. Context window bloat: Large MCP payloads (for example, 40KB responses) persisting in context and incurring repeated billing on subsequent turns. Cache expiration inefficiencies: Resuming sessions after extended breaks where expired prompt caches force full-price prefix rebuilds. Prompt initialization overhead: Pre-loading 100,000 tokens of system instructions and tool definitions before any user input is provided. Figure 12: Session-level cost dashboard identifies waste patterns and potential savings. What’s Next? Current initiatives in progress include: Growing the fleet of managed agents: For every new agent, we follow a consistent roadmap: establish target outcome metrics, assemble evaluation benchmarks, and identify a Pareto-optimal model. This systematic approach aims to elevate each stage of the SDLC higher up the factory maturity model. Dynamic Model Routing: We’re expanding benchmark coverage across diverse programming languages, code repositories, and agent modalities. Effective model routing relies heavily on comprehensive evaluation, given that model capabilities vary widely. Deepening context-graph integration: We’re unlocking graph query capabilities across a wider selection of autonomous agents. Evolving session analytics into real-time developer guidance: By shifting from periodic batch detection of anti-patterns to continuous trace monitoring, we aim to deliver personalized, real-time efficiency recommendations directly to engineers. Continuous Skill Improvement: We are working on an automated way to record papercuts from agent skill executions and auto-generate skill updates from the collected traces. Conclusion Managing and curbing rising AI coding expenses is also a tractable engineering challenge. By eliminating wasted, zero-value token consumption rather than relying solely on lower unit prices or downgrading tooling, we scaled usage 7x while simultaneously reducing unit costs across all metrics and improving/maintaining output quality. The core strategic shift is moving from interactive developer workflows to fully managed agents. Transitioning SDLC workloads into managed environments grants complete control over model routing, execution harnesses, and operational spend. Optimizing a fleet of specialized managed agents, each paired with dedicated evaluation benchmarks and a Pareto-efficient model, is inherently more cost-effective and scalable than optimizing individual terminal sessions across thousands of engineers. Acknowledgments This is a collective effort by many engineers who are building the most efficient blocks to implement Software Factory at Uber scale, while ensuring we get ROI for every token we spend. We would like to thank our core team involved in various efforts across Software Factory listed here: Abhishek Bhatia, Adam Huda, Aditya Patel, Alok Srivastava, Ameya Ketkar, Anil Purohit, Atakan Kandemir, Ben Chou, Brandon Barker, Danielle Yim, Deepanshu Mehndiratta, Gaurav Gill, Israel Marban, Jason Varbedian, Karen Xu, Lei Shi, Mager Mager, Meghana Somasundara, Peng Liu, Preet Inder, Qiushen Wang, Rush Tehrani, Shesh Patel, Shiven Tripathi, Shubham Gupta, Stas Khalup, Ting Chen, Tse-Shi Wang, Ty Smith, Vikram Hullukunte, Weiqiang Wang, Will Bond. Also would like to thank Johannes Gehrke, Mattie Toia, Sumanth Sukumar, and Praveen Neppalli Naga for their leadership.

Anthropic® is a registered trademark of Anthropic PBC. Claude Code™ and Claude® are trademarks of Anthropic, PBC. OpenAI® and its logos are registered trademarks of OpenAI®.
如今,AI 工具已深度融入 Uber 软件开发的各个阶段。超过 70% 的拉取请求(Pull Requests)由本地或云端智能体(Agents)完成。工程师们在软件开发生命周期(SDLC)中构建了超过 3,600 项智能体技能(Agent Skills),每日智能体技能执行次数超过 3 万次。

在 AI Engineer 2026 大会上,我们分享了关于“软件工厂(Software Factory)”的愿景,以及我们在整个生命周期中构建的基础模块与托管智能体(Managed Agents)。随着这一愿景的推进,越来越多的会话不再由人类发起,而是由自动化的托管智能体负责处理代码审查、自动修复 CI 失败、通过视觉验证完成端到端(E2E)PR、分类处理待命警报、调试新出现的 Bug,并在人工审查/升级机制的辅助下处理各类代码维护任务。

如图 1 所示,从 2026 年 2 月至 8 月,我们全体员工(工程师与非工程师)在所有智能体服务(Agentic Offerings)上的周活跃用户数增长了 7 倍,周智能体请求量增长了 9.4 倍。与此同时,得益于全面的优化措施,我们的 AI 总支出自 4 月以来已趋于相对稳定。 图 1:2026 年 2 月至 8 月中旬的周活跃用户、智能体请求量与成本数据(用户已跨工具去重)。

由于采用率、工作负载组合以及模型升级都在持续变化,要准确剥离我们自身的优化收益,就必须固定单一模型进行测试,因为每次升级或更换模型家族都会导致行为发生变化。我们在 2 月至 7 月期间采用了这一方法:每 1,000 次模型请求的成本较峰值下降了近 34%,单次会话成本较 6 月峰值下降了 52%。 图 2:固定模型情况下的成本优化效果。*单次会话成本数据自 5 月底开始统计。 本文将详细阐述我们对“软件工厂”的思考框架:智能体会话运行的四个层级、用于拆解支出的成本公式、各项指标的测量方法,以及我们如何在每个层级上对这些指标进行优化。

本文对比中的所有定价与供应商指标均基于公开信息,成本效率的提升主要源于在标准分级定价体系内更智能地路由我们内部的 Uber 工作负载。尽管我们测得的具体成本降幅具有环境独特性,且实际效果会因代码库规模、团队大小及智能体工作流的不同而有所差异,但“基于真实工作负载进行基准测试,并围绕准确率与成本进行优化”的方法论具有普适性。

软件工厂及其成本公式 智能体使用的四个层级 我们将 AI 的使用划分为四个层级,从最专用到最通用。如图 3 所示,层级越高,我们在成本、质量和模型选择上的控制力就越强。 图 3:智能体会话运行的四个层级。 成本公式 在上述任意层级中,我们都可以将智能体会话的成本拆解为以下各项指标,并对其进行独立测量与优化。 图 4:总支出拆解为六个相乘的指标项。 前两项指标代表采用率与参与度,我们希望这些指标在整个用户群中持续增长,无论用户是交互式使用,还是由智能体代为处理任务。中间的三项指标则提供了优化空间:即智能体在工程师实际发起的请求之外,为自身运行所额外产生的工作。这也是我们投入精力最多的地方。其中包括帮助智能体更快规划、减少不必要的交互轮次或错误、优化输入 Token 等机制。

我们的测量方法 以下是我们每周和每月追踪的完整指标集,这些指标使我们能够进行短期与长期的预测及规划。

优化杠杆 在接下来的章节中,我们将详细说明用于优化成本公式各部分的关键杠杆。其中部分杠杆会影响成本公式中的一行或多行指标。

优化 价格 / Token Token 单价由供应商设定,而我们决定由哪个模型运行哪项工作负载。在所有托管智能体层级中,我们都会为特定工作负载选择帕累托最优(Pareto efficient)的模型。对我们而言,帕累托最优意味着在“单次完成任务成本”、“输出质量”和“模型可靠性”之间取得最佳平衡。

基于基准测试的模型选择 模型选择分为四个步骤,适用于我们运行的每一个托管智能体。 - 基于智能体的真实工作构建基准测试集。 - 在统一的执行框架(Harness)上运行智能体,该框架通过单一接口支持任意模型(无论是前沿闭源模型还是开源权重模型)。 - 持续迁移至帕累托最优的模型,并保持动态调整。最优前沿每几周就会发生变化。 - 展望未来,我们将持续利用托管智能体聚合的洞察来测试和部署多种模型路由策略,从而不断优化工作负载性能。

以 uReview 为例,该工具负责处理所有拉取请求的 AI 代码审查。我们基于包含已知 Bug 的真实 PR 构建了其基准测试集,并将其难度划分为简单、中等和困难。我们针对这些 Bug 计算精确率、召回率和 F1 分数,同时评估单次审查成本、延迟、超时和噪声。如图 5 所示,切换模型在提升 F1 分数的同时,大幅降低了单次 PR 成本。图中虚线代表帕累托前沿。位于该线左下方的所有配置,均被更便宜或更优的方案所超越。 图 5:我们为 uReview 测试的所有配置。 基于我们大型单体仓库(Monorepos)中的数千个真实 PR,我们内部还构建了一个 Uber SWE Benchmark,用于在不同任务类型上运行前沿模型与开源权重模型。该基准测试为我们在所有 SDLC 托管智能体中的模型选择提供决策依据。

默认模型选择 在交互式界面中,Token 单价保持固定;但我们可以策略性地管理 Token 在不同模型间的分配。两个默认设置主要控制这一分配:初始会话模型与子智能体(Subagent)模型。

事实证明,子智能体默认设置是最具影响力的优化杠杆,且其重要性仍在不断提升。随着最新模型能力支持更高效的多智能体编排,发起子智能体的会话比例稳步上升。由于子智能体通常执行定义明确、输入特定的任务,往往无需前沿级别的推理能力,因此我们默认将其分配给性能稍弱但更具成本效益的模型,同时保留手动覆盖的选项。主模型负责任务拆解与评估,而子智能体负责具体执行。

优化 Token / 请求 每次交互轮次都会重新发送完整的对话历史、项目上下文和工具结果。任何能减少单次请求负载的优化,都会在整个会话中产生累积效应。

默认配置 所有交互式执行框架均采用统一的封装层,用于安装管理、配置、身份验证和成本可视化。两项标准化默认配置直接降低了单次请求的 Token 消耗: - 自动压缩(Automatic compaction)在达到 40 万 Token 时触发,即使对于拥有 100 万上下文窗口的模型也是如此:该阈值在模型性能、缓存突发与重复输入 Token 成本之间取得了平衡。我们的测量数据显示,全集群单次请求的输入 Token 数量实现了显著下降。 - 推理强度(Reasoning effort)默认设置为“中等”:输出 Token(包括内部推理 Token)在主模型上的计费倍率高于输入 Token;此项策略调整直接降低了最高成本 Token 类别的支出。对于大量任务而言,“中等”推理强度在成本与质量之间取得了良好平衡。

提示词缓存策略 我们的提示词缓存策略由供应商提示词缓存读写成本的经济性驱动。由于每次交互都会重新传输完整的对话历史,缓存前置上下文可避免重复支付全额费用,将后续读取成本降至标准输入 Token 费率的 0.1 倍。然而,写入溢价有所不同:5 分钟缓存条目成本为 1.25 倍,1 小时缓存条目成本为 2 倍。因此,选择最优的生存时间(TTL, Time-to-Live)取决于交互轮次之间的间隔时长。可用的 TTL 选项包括 Anthropic® 提供的 5 分钟和 1 小时,以及 OpenAI® 提供的 30 分钟。 图 6:两种 TTL 时长下 5 轮交互的对比。 由于工程师经常让交互式会话空闲超过 5 分钟,我们将默认的 5 分钟 TTL 切换为 1 小时窗口。此前,频繁的空闲间隔会导致前缀缓存失效,迫使系统以全价重建上下文,成本高昂。相比之下,子智能体仍保留 5 分钟的缓存 TTL,因为它们的执行范围仅限于单一、短生命周期的任务。

通过 Shell 执行 MCP 工具 在 Uber,所有 MCP(模型上下文协议,Model Context Protocol)交互均通过统一网关进行路由。这一单一入口涵盖了内部及第三方 SaaS 的 1,000 多个 MCP 服务器,实现了集中式身份验证与策略执行。

然而,标准 MCP 会将所有工具模式(Schemas)直接加载到每个会话中,无论工程师在该会话中是否会调用它们。例如,安装超过 100 个工具时,这种预加载会在初始提示词中增加约 5 万至 7 万 Token 的模式开销,并在每次上下文轮次中重新发送。 图 7:在三种访问相同工具的方式下,智能体在会话开始时已携带的负载。

为解决上下文膨胀问题,我们引入了两种互补的优化机制: - CLI 工具解析:通过允许模型执行 Shell 命令来替代直接的 MCP 集成。CLI 在调用时动态向网关解析并调用所需工具,从而从会话上下文中剔除 Uber MCP 模式。我们内部 MCP 网关的 1,000 多个 MCP 工具均被映射为 CLI 命令。 - 工具搜索:通过允许模型搜索工具目录并按需加载所需工具,可扩展至数千个工具。该方法有效缓解了上下文膨胀,通常能减少工具定义的 Token 使用量,并且在可用工具库不断扩大的情况下仍能保持高选择准确率,避免了大型工具集带来的性能衰减。

代码模式(Code-Mode) 当工具直接以 Shell 命令形式调用函数时,模型可以在单个脚本中批量执行多个操作。这种批处理对于交互频繁的工具协议尤为有利。在标准 MCP 工作流中,每个操作都需要模型单独发起一轮交互来发送请求、将原始响应加载到上下文窗口中,并顺序处理结果。例如,执行单个 SQL 查询需要提交请求、轮询状态 2 到 5 次,然后检索输出。代码模式将整个流程简化为自动化的 Python 循环,使中间轮询过程脱离模型的活跃上下文。如图 8 左侧所示,模型参与轮询循环,每次响应都会进入其上下文。而在右侧,循环在子进程中运行,仅返回最终摘要。 图 8:同一数据仓库查询的两种执行方式。 我们在同一会话中通过两种路径运行了 5 个相同的 SQL 查询,并进行了测量: 前三行数据突出了核心发现:即使对于远低于响应大小限制的最小结果集,代码模式也能将 Token 使用量减少 50% 以上。这些效率提升并非源于绕过大型数据负载,而是消除了不必要的开销,包括模式初始化、多轮轮询以及冗余的逐步推理。 批量工作流会进一步放大这一效果,因为原本需要 N 轮模型交互的循环被合并为一个脚本,节省比例累积超过 90%。通过为我们访问最频繁的 MCP 服务器部署 25 个以上的预构建代码模式技能,我们确保了标准工作流默认采用最具成本效益的路径。

SaaS MCP 服务 管理第三方软件被证明比管理我们的内部服务器更具挑战性。供应商设计 MCP 服务器时倾向于暴露完整的产品能力,因为他们无法预测客户的具体使用场景。例如,某办公套件将 49 个工具捆绑在单个服务器中,需要约 2.2 万 Token 的模式开销;而消息传递和项目跟踪供应商分别提供 34 个和 46 个工具。加载两三个供应商服务器,会导致智能体在用户输入提示词之前就携带了比正在编辑的文件还要大的模式开销。

为解决这一问题,我们采用与内部 MCP 相同的机制,将 SaaS MCP 服务器路由至我们的 MCP 网关。我们还将所有这些 MCP 暴露为 CLI,供任何智能体界面调用。此外,我们在代码模式插件中为每个服务器编写了专用技能,以封装常见工作流。此举为众多 SaaS 供应商解锁了高效的智能体工作流。 图 9:每个 SaaS MCP 服务器均通过我们的 MCP 网关暴露,以确保统一、高效的访问模式。

优化 请求 / 交互轮次 缺乏上下文锚定(Ungrounded)的智能体往往失败得缓慢而非廉价,它会反复发送不断膨胀的上下文窗口去尝试搜索下一个位置。在初始阶段提供更丰富的信息,依然是降低此类搜索开销最核心的优化杠杆。

上下文工程(Context Engineering) 在 Uber 庞大的代码库与数据生态系统中(包含数亿行代码和数千张数据表),智能体将大部分交互轮次用于定位信息,而非生成代码。为此,我们构建了 AI 上下文图谱(AI Context Graph):一个包含 2,400 万个节点和 8,000 万条边的统一网络,涵盖 86 种节点类型和 117 种边类型。它整合了来自 30 多个内部系统的数据,包括服务、工程团队、事件日志、拉取请求、架构设计文档、部署记录、数据集以及历史表使用查询,并允许任何智能体通过自然语言对其进行查询。 图 10:向同一模型提交相同提示词时,有图谱锚定与无图谱锚定的执行路径对比。

经过图谱锚定的智能体查询了历史使用情况,识别出被 50 多位分析师使用的特定数据表,并在 38 秒内给出了答案。相反,未经锚定的智能体对该表缺乏可见性;它花费了 20 分钟检查服务代码、派生了 2 个子智能体、触发了 3 次错误,最终错误地得出该数据集无法查询的结论。

可见性与教育 此处的优化杠杆在于可见性与反馈循环,它们能帮助工程师和智能体更快地达成一致。

状态行(Status Line) 我们在执行框架的状态行中加入了实时成本计数器,用于追踪每个框架及每位用户所有框架的实时支出。 图 11:状态行,以及随附的会话分析器与效率指南。

可见性与支出分级 为避免实施严格的硬性上限,我们实现了实时支出追踪与自动提醒机制: - 状态行实时计数器。运行中会话的成本始终在终端中可见。 - 框架池(Harness Pool)。所有交互式框架共享一个支出分级额度,而非按工具单独设置预算。托管智能体则设有独立的分级额度。 - Slack 提醒。在达到预期支出的 50%、80% 和 100% 时发送警报,以便工程师有时间进行规划。 - 简易审批流程。分级额度升级只需经理审批,并快速生效。 - 成本检查技能与提示。提供按需成本拆解的仪表盘技能,以及实时状态行指导。 这些机制使工程师能够独立评估任务的投资回报率(ROI),同时有效遏制成本失控。

会话分析仪表盘 尽管状态行突出了会话的总支出,但它无法揭示成本驱动因素或提供可执行的效率改进步骤。通用指南仅提供高层级原则,无法评估单个开发者的工作流。会话分析仪表盘通过直接检查会话产物来弥补这一差距。

该功能直接内置于运行时中,无需任何设置或主动启用。执行成本仪表盘技能即可分析用户在其使用的所有框架中,本地与远程云沙盒的所有会话追踪记录。它不生成聚合指标,而是标记出会话中 16 种不同的反模式(Anti-patterns),并为每种模式附上财务影响与针对性的修复建议。部分类别包括: - 模型路由次优:在 Opus 模型上执行简单的多轮会话,而此类任务本可由 Sonnet 轻松完成。 - 上下文窗口膨胀:大型 MCP 负载(例如 40KB 的响应)持续保留在上下文中,导致后续轮次重复计费。 - 缓存过期低效:长时间中断后恢复会话,过期的提示词缓存迫使系统以全价重建前缀。 - 提示词初始化开销:在提供任何用户输入之前,预加载 10 万 Token 的系统指令与工具定义。 图 12:会话级成本仪表盘识别浪费模式与潜在节省空间。

下一步计划? 当前正在推进的举措包括: - 扩大托管智能体集群:对于每个新智能体,我们遵循一致的路线图:确立目标结果指标、构建评估基准测试集,并识别帕累托最优模型。这一系统化方法旨在将 SDLC 的每个阶段提升至软件工厂成熟度模型的更高层级。 - 动态模型路由:我们正在扩大基准测试的覆盖范围,涵盖多种编程语言、代码仓库和智能体模态。鉴于模型能力差异巨大,有效的模型路由高度依赖于全面的评估。 - 深化上下文图谱集成:我们正在为更广泛的自主智能体解锁图谱查询能力。 - 将会话分析演进为实时开发者指导:通过从定期批量检测反模式转向持续追踪监控,我们旨在直接向工程师提供个性化、实时的效率建议。 - 持续技能改进:我们正在开发一种自动化方法,用于记录智能体技能执行中的细微痛点(Papercuts),并根据收集的追踪记录自动生成技能更新。

结论 管理与遏制不断攀升的 AI 编码成本,同样是一个可解的工程挑战。通过消除浪费的、零价值的 Token 消耗,而非单纯依赖降低单价或降级工具,我们在将使用规模扩大 7 倍的同时,全面降低了各项指标的单位成本,并提升或保持了输出质量。

核心战略转变在于从交互式开发者工作流转向全托管智能体。将 SDLC 工作负载迁移至托管环境,使我们能够完全掌控模型路由、执行框架与运营支出。优化一个由专用托管智能体组成的集群(每个智能体均配备专属评估基准与帕累托最优模型),其成本效益与可扩展性天然优于优化数千名工程师各自的终端会话。

致谢 这是众多工程师共同努力的成果,他们正在构建最高效的基础模块,以在 Uber 规模上落地软件工厂,同时确保我们花费的每一个 Token 都能获得投资回报。我们要感谢参与软件工厂各项工作的核心团队成员:Abhishek Bhatia, Adam Huda, Aditya Patel, Alok Srivastava, Ameya Ketkar, Anil Purohit, Atakan Kandemir, Ben Chou, Brandon Barker, Danielle Yim, Deepanshu Mehndiratta, Gaurav Gill, Israel Marban, Jason Varbedian, Karen Xu, Lei Shi, Mager Mager, Meghana Somasundara, Peng Liu, Preet Inder, Qiushen Wang, Rush Tehrani, Shesh Patel, Shiven Tripathi, Shubham Gupta, Stas Khalup, Ting Chen, Tse-Shi Wang, Ty Smith, Vikram Hullukunte, Weiqiang Wang, Will Bond。 同时感谢 Johannes Gehrke, Mattie Toia, Sumanth Sukumar 和 Praveen Neppalli Naga 提供的领导与支持。

Anthropic® 是 Anthropic PBC 的注册商标。 Claude Code™ 和 Claude® 是 Anthropic, PBC 的商标。 OpenAI® 及其徽标是 OpenAI® 的注册商标。

Post author: @udaykiran AI tools are now embedded in every phase of software development at Uber. More than 70% of pull requests are attributed to local or cloud agents. Engineers have built over 3,600 agent skills across the software development life cycle, and executed more than 30K agent skill executions per day. At the AI Engineer 2026 conference, we shared our vision for the Software Factory and the building blocks and managed agents we are building across the lifecycle. As we progress on that vision, a growing share of sessions aren’t initiated by humans, but by automated managed agents handling code review, self-healing CI failures, completing E2E PRs with visual validation, triaging on-call alerts, debugging incoming bugs, and handling a variety of code maintenance tasks with human reviews/escalations. As shown in Figure 1, from February to Aug 2026, weekly active users across all agentic offerings across all our employees (engineers & non-engineers) grew 7x, and weekly agentic requests grew 9.4x. Meanwhile, our total AI spend has relatively stabilized since April due to optimizations across the board. Figure 1: Weekly active users, agent requests, and cost from Feb–Mid Aug 2026, with users deduplicated across tools.

Since adoption, workload mix, and model upgrades are all continuously changing, isolating our own optimization gains means holding one model fixed, since behavior shifts with every upgrade and model family. We did that from February to July: cost per 1,000 model requests is down almost 34% from its peak, and cost per session is down 52% from its June peak. Figure 2: Cost optimization impact with model held constant. *Cost/session data starts from end of May. This blog walks through how we think about our software factory: the four layers agent sessions run in, the cost equation we use to decompose spend, how we measure each term, and how we optimize those terms across every layer. All pricing and vendor metrics in this comparison are based on publicly available information, with cost efficiency gains driven by routing our internal Uber workloads more intelligently within standard tier-pricing. While specific cost reductions we measure are unique to our environment and your mileage may vary depending on your codebase, team size, and agent workflows, the methodology of benchmarking real work and optimizing for accuracy and cost is universally applicable. The Software Factory and Its Cost Equation Four Layers of Agent Usage We organize AI usage into four layers, from the most specialized to the most general. As shown in Figure 3, the higher the layer, the more control we have over cost, quality, and model selection. Figure 3: The four layers where agent sessions run. The Cost Equation Across any of the layers above, we can decompose the cost of an agentic session into the following terms, which we could measure and optimize independently. Figure 4: Total spend, decomposed into six terms that multiply. The first two terms represent adoption & engagement, which we want to keep growing across our overall user base, whether users use it interactively or agents handle tasks on their behalf. The three middle terms provide opportunities for optimization: the work the agent does on its own behalf, on top of the request an engineer actually made. That is where most of our effort goes. This includes mechanisms that help agents plan faster, reduce unwanted turns or errors, optimize input tokens, and more. How We Measure Below is the full set of metrics we track weekly and monthly that enable us to forecast & plan our efforts short-term and long-term. Optimization Levers In the following sections, we detail the key levers we used to optimize each part of the cost equation. Some of these levers affect one or more rows in the cost equation. Optimizing Price / Token The vendor sets the token price. We pick which model runs which workload. Across all our managed agents’ layers, we pick the model that’s most Pareto efficient for that workload. For us, Pareto efficient means cost/completed task, output quality, and model reliability. Benchmark-Driven Model Selection Model selection happens in four steps, the same for every managed agent we run. Build a benchmark out of the agent’s real work. Run the agent on a harness that serves any model, frontier or open-weight, behind one interface. Move to whatever is Pareto optimal, and keep moving. The frontier shifts every few weeks. Looking ahead, we continually refine our workload performance by leveraging aggregated insights from our managed agents to test and deploy various model routing strategies. For example, we use uReview, which handles AI code review for all pull requests. We built its benchmark from real pull requests with known bugs and graded them easy, medium, and hard. We score precision, recall, and F1 against those bugs, plus cost per review, latency, timeouts, and noise. As shown in Figure 5, switching models improved our F1 while dramatically reducing cost/PR. In the figure, the dashed line is the Pareto frontier. Everything below and left of it is beaten by something cheaper or better. Figure 5: Every configuration we tested for uReview. Using thousands of real-world PRs across our large monorepos, we internally also have an Uber SWE Benchmark that runs frontier and open-weight models across different task types. We use it to inform model selection across all our SDLC-managed agents. Default Model Selection In the interactive interface, token unit costs remain fixed; however, you can strategically manage token distribution across models. Two default settings primarily govern this distribution: the initial session model and the subagent model. The subagent default setting has proven to be the most impactful lever, and its significance continues to grow. The proportion of sessions initiating subagents has steadily increased as the latest model capabilities enable more effective multi-agent orchestration. Because subagents perform well-defined tasks with specified inputs that often do not require frontier-level reasoning, we default them to a weaker, more cost-effective model while still allowing manual overrides. The primary model handles task decomposition and evaluation while subagents execute the work. Optimizing Tokens / Request Every turn re-sends the full conversation history, project context, and tool results. Anything that reduces the per-request payload compounds across the session. Defaults All interactive harnesses use a unified wrapper for installation management, configuration, authentication, and cost visibility. Two standardized default configurations directly reduce token consumption per request: Automatic compaction is triggered at 400k tokens even for 1M context window models: This threshold balances model performance against cache bursts and repeated input token costs. Our measurements show a meaningful reduction in fleet-wide input tokens per request. Reasoning effort defaulted to Medium: Output tokens, including internal reasoning tokens, are billed at multiples of the rate of input tokens on primary models; this policy adjustment directly reduces spend in the highest-cost token category. For a large category of tasks, Medium reasoning hits a good balance between cost vs quality. Prompt Caching Strategy Our prompt caching strategy is driven by the economics of provider prompt cache reads and writes. Since each turn re-transmits the full conversation history, caching the preceding context avoids paying the full cost repeatedly, reducing subsequent reads to just 0.1x the standard input token rate. However, write premiums vary: 5-minute cache entries cost 1.25x, while 1-hour entries cost 2x. Choosing an optimal TTL (Time-to-Live) therefore depends on the duration of gaps between turns. Available TTL options include 5 minutes and 1 hour from Anthropic®, alongside 30 minutes from OpenAI®. Figure 6: A comparison of 5 turns under both TTL durations. Because engineers often leave interactive sessions idle for more than 5 minutes, we transitioned from the default 5-minute TTL to a 1-hour window. These frequent idle gaps previously invalidated the prefix cache, forcing costly full-price context rebuilds. Sub-agents, by contrast, retain a 5-minute cache TTL because their execution focus is limited to single, short-lived tasks. Executing MCP Tools via the Shell At Uber, all MCP (Model Context Protocol) interactions are routed through a unified gateway. This single entry point encompasses more than 1,000 MCP servers across internal and third-party SaaS MCP, enabling centralized authentication and policy enforcement. However, standard MCP loads all tool schemas directly into every session, regardless of whether an engineer will ever invoke them in that session or not. For example, with over 100 tools installed, this pre-loading added approximately 50K-70K tokens of schema overhead to the initial prompt, which was subsequently re-sent on every context turn. Figure 7: What an agent is already carrying at the start of a session, under 3 ways of reaching the same tools.

To address this context bloat, we introduced two complementary optimization mechanisms: CLI tool resolution: Replaces direct MCP integration by allowing the model to execute a shell command. The CLI resolves and invokes the required tool against the gateway dynamically at call time, eliminating Uber MCP schemas from the session context. All 1K+ MCP tools from our internal MCP gateway are projected as CLI commands. Tool search: Scales to thousands of tools by allowing the model to search the tool catalog and load only required tools on demand. This approach mitigates context bloat, typically reducing token usage for tool definitions, and maintains high selection accuracy even as the available tool library expands, preventing degradation associated with large tool sets. Code-Mode When tools call functions directly as shell commands, models can batch multiple actions within a single script. This batching is particularly advantageous for chatty tool protocols. Under standard MCP workflows, each action requires a separate model turn to emit a request, load the raw response into the context window, and process the results sequentially. For instance, executing a single SQL query requires submitting the request, polling status 2 to 5 times, and retrieving the output. Code-mode streamlines this entire flow into an automated Python loop, keeping intermediate polling out of the model’s active context. As shown in Figure 8 on the left, the model participates in the polling loop, and every response lands in its context. On the right, the loop runs in a subprocess, and only the summary comes back. Figure 8: The same warehouse query, both ways. We measured this by running 5 identical SQL queries through both paths in the same session: The initial three rows highlight the main finding: even for minimal result sets far below response-size limits, code-mode reduces token usage by more than 50%. Rather than bypassing large data payloads, these efficiencies stem from eliminating unnecessary overhead, including schema initialization, multi-turn polling, and redundant step-by-step reasoning. Bulk workflows compound the effect, because the loop that would have been N model turns becomes one script and the savings compound to more than 90%. By deploying more than 25 pre-built code-mode skills for our most-accessed MCP servers, we ensure standard workflows default to the most cost-effective path. SaaS MCPs Managing third-party software proved significantly more challenging than our internal servers. Vendors design MCP servers to expose full product capabilities because they can't anticipate specific customer usage. For instance, a workspace suite bundles 49 tools into a single server, requiring ~22K tokens of schema, while messaging and project tracking vendors ship 34 and 46 tools, respectively. Loading two or three vendor servers makes the agent carry more schema overhead than the file being edited before a user even enters a prompt. To address this, we route SaaS MCP servers through our MCP gateway using the same mechanism we do for our internal MCPs. We also expose all these MCPs as CLIs that any agentic surface can invoke. Additionally, we author dedicated skills within our code-mode plugin for each server to encapsulate common workflows. This unlocked efficient agentic workflows across many SaaS vendors. Figure 9: Every SaaS MCP server is exposed behind our MCP gateway to ensure a unified, efficient access pattern.

Optimizing Requests / Turn An ungrounded agent fails slowly rather than cheaply, repeatedly sending an expanding context window to search one more location. Providing richer information upfront remains the single most powerful lever to reduce this search overhead. Context Engineering Across Uber’s vast codebase and data ecosystem, comprising hundreds of millions of code lines and thousands of tables, agents spend most of their turns locating information rather than generating code. To address this, we engineered the AI Context Graph: a unified network containing 24 million nodes and 80 million edges across 86 nodes and 117 edge types. It integrates data from over 30 internal systems, including services, engineering teams, incident logs, pull requests, architectural design docs, deployments, datasets, and historical table usage queries, and lets any agent query it in natural language. Figure 10: Comparing execution paths for the identical prompt submitted to the same model, with and without graph grounding.

The grounded agent queried historical usage, identified the specific table used by over 50 analysts, and delivered the answer in 38 seconds. Conversely, the ungrounded agent lacked visibility into that table; it spent 20 minutes inspecting service code, spawning 2 subagents, and hitting 3 errors before incorrectly concluding the dataset was unqueryable. Visibility & Education The levers here are visibility and feedback loops that help engineers and agents converge faster. The Status Line We put a live cost counter in the harness status line that tracks live spend per harness and across all harnesses for each user. Figure 11: The status line, with the session analyzer and efficiency guide that ship alongside it.

Visibility and Spend Tiers To avoid imposing strict caps, we implemented real-time spend tracking and automated nudges: Statusline live counter. Running session cost is always visible in the terminal. Harness pool. One shared tier across all interactive harnesses, not per-tool budgets. And separate tiers for managed agents. Slack nudges. Alerts at 50/80/100% of expected spend so engineers have time to plan. Easy approval flows. Manager sign-off for tier upgrades with quick propagation. Cost check skill and tips. A dashboard skill for on-demand cost breakdown and live status line coaching. These enable engineers to evaluate task ROI independently while mitigating runaway expenses. Session Analysis Dashboard While the status line highlights a session's total expenditure, it lacks visibility into cost drivers or actionable efficiency steps. General guidance provides high-level principles, but can’t evaluate individual developer workflows. The session analysis dashboard bridges this gap by inspecting session artifacts directly. Built directly into the runtime, it requires zero setup or opt-in. Executing the cost dashboard skill analyzes all session traces for the user across local and remote cloud sandboxes across all harnesses they use. Rather than producing an aggregate metric, it flags 16 distinct anti-patterns across sessions, pairing each with its financial impact and a targeted remediation. Some of the categories include: Suboptimal model routing: Executing simple multi-turn sessions on Opus that Sonnet could easily fulfill. Context window bloat: Large MCP payloads (for example, 40KB responses) persisting in context and incurring repeated billing on subsequent turns. Cache expiration inefficiencies: Resuming sessions after extended breaks where expired prompt caches force full-price prefix rebuilds. Prompt initialization overhead: Pre-loading 100,000 tokens of system instructions and tool definitions before any user input is provided. Figure 12: Session-level cost dashboard identifies waste patterns and potential savings. What’s Next? Current initiatives in progress include: Growing the fleet of managed agents: For every new agent, we follow a consistent roadmap: establish target outcome metrics, assemble evaluation benchmarks, and identify a Pareto-optimal model. This systematic approach aims to elevate each stage of the SDLC higher up the factory maturity model. Dynamic Model Routing: We’re expanding benchmark coverage across diverse programming languages, code repositories, and agent modalities. Effective model routing relies heavily on comprehensive evaluation, given that model capabilities vary widely. Deepening context-graph integration: We’re unlocking graph query capabilities across a wider selection of autonomous agents. Evolving session analytics into real-time developer guidance: By shifting from periodic batch detection of anti-patterns to continuous trace monitoring, we aim to deliver personalized, real-time efficiency recommendations directly to engineers. Continuous Skill Improvement: We are working on an automated way to record papercuts from agent skill executions and auto-generate skill updates from the collected traces. Conclusion Managing and curbing rising AI coding expenses is also a tractable engineering challenge. By eliminating wasted, zero-value token consumption rather than relying solely on lower unit prices or downgrading tooling, we scaled usage 7x while simultaneously reducing unit costs across all metrics and improving/maintaining output quality. The core strategic shift is moving from interactive developer workflows to fully managed agents. Transitioning SDLC workloads into managed environments grants complete control over model routing, execution harnesses, and operational spend. Optimizing a fleet of specialized managed agents, each paired with dedicated evaluation benchmarks and a Pareto-efficient model, is inherently more cost-effective and scalable than optimizing individual terminal sessions across thousands of engineers. Acknowledgments This is a collective effort by many engineers who are building the most efficient blocks to implement Software Factory at Uber scale, while ensuring we get ROI for every token we spend. We would like to thank our core team involved in various efforts across Software Factory listed here: Abhishek Bhatia, Adam Huda, Aditya Patel, Alok Srivastava, Ameya Ketkar, Anil Purohit, Atakan Kandemir, Ben Chou, Brandon Barker, Danielle Yim, Deepanshu Mehndiratta, Gaurav Gill, Israel Marban, Jason Varbedian, Karen Xu, Lei Shi, Mager Mager, Meghana Somasundara, Peng Liu, Preet Inder, Qiushen Wang, Rush Tehrani, Shesh Patel, Shiven Tripathi, Shubham Gupta, Stas Khalup, Ting Chen, Tse-Shi Wang, Ty Smith, Vikram Hullukunte, Weiqiang Wang, Will Bond. Also would like to thank Johannes Gehrke, Mattie Toia, Sumanth Sukumar, and Praveen Neppalli Naga for their leadership.

Anthropic® is a registered trademark of Anthropic PBC. Claude Code™ and Claude® are trademarks of Anthropic, PBC. OpenAI® and its logos are registered trademarks of OpenAI®.
📋 讨论归档

讨论进行中…